Download

1 / 15
180 likes | 464 Views
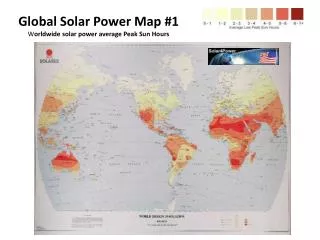
Global Solar Power Map #1 W orldwide solar power average Peak Sun Hours. US TOP 20 PV Plants. Top 5 Nellis AFB, AZ 14MW El Dorado, NV 13 MW Alamosa, CO 8 MW Springville, AZ 5 MW Rancho Seco,CA 4 MW 9 California Plants Top 20 PV Plants. US Photovoltaic Energy Status.

E N D
Global Solar Power Map #1Worldwide solar power average Peak Sun Hours
US TOP 20 PV Plants • Top 5 • Nellis AFB, AZ 14MW • El Dorado, NV 13 MW • Alamosa, CO 8 MW • Springville, AZ 5 MW • Rancho Seco,CA 4 MW • 9 California Plants Top 20 PV Plants
US Photovoltaic Energy Status • US PV Grid Connected PV demand Grows • 2009 544 MW • Largest - California, Arizona, New Jersey, New Mexico, New York, Nevada and Colorado • 2010 650 MW (Est.) • 2012 1500-2000 MW (EST) • WORLD LEADER BY 2012 • Bigger than Spain or Germany
US PV Cell and Module Manufacturing 2012 Est Market Share Crystalline 35% Thin Films 65% 2012 Thin Films Market Share CdTe 18% Amorphous Si 24% CIGS 22% U.S. cell and module capacity are estimated to grow at an annualized rate of 50 percent and 45 percent respectively from 2008 to 2012
US Solar System Cost Competitiveness Small Systems $/W Silicon $/Kg Wafers $/W C- Si Modules $/W C –Si Cells $/W Ref: iSuppli Report 2009
US Solar PV Status and Plans • US and State incentives accelerated in 2009 Installed Capacity Growth 64% in 2009. Cost Parity still not viable. • Manufacturing Cost reduction resulting in “STEEP” price decline -- resulting in acceleration of Cost reduction plans • “Holy Grail” Cell Prices of $1 /W may be reached in 2010 • Module Prices Drop 38% in 2009 to $2.5 /W, Expected to Drop 20% in 2010 to $2 /W • Installed System Cost Small Systems <$5/W, Commercial System Cost <$3.0/W in 2010 • Impact of Global demand change cause major Cost variations – Spain / Germany Policy impact -- China increased Manufacturing -> Over supply of Solar Silicon • Overall Global and US Solar industry to grow significantly. • GOOD JOB OPPORTUNITIES FOR NEXT SEVERAL YEARS Source : Solid solar.com Web site
Figure 1: PV revenues, profit and margins for DisplaySearch's index of module manufacturers.Source: DisplaySearch Quarterly PV Cell Capacity Database & Trends Report
US Solar Map Source : Solid solar.com Web site
Residential/Commercial / Utility Level PV energy Applications • New Residential Financial Models fueling growth • Commercial Roof Top market • Utility Scale is Fastest growing market