Analyzing Rainfall Estimation Errors in Hurricane Fran Using Radar Data
170 likes | 307 Views
This study examines the impact of various factors on radar-derived rainfall estimations during Hurricane Fran, particularly focusing on mis-calibration, beam blockage, and range degradation. By comparing data from Sterling, VA (KLWX) and Raleigh, NC (KRAX), we highlight a 5 dBZ difference in radar returns, especially in intense echoes. We explore the implications of using incorrect Z-R conversion relationships on rainfall rates, with investigations into how beam blockage by terrain impacts data accuracy. Findings suggest that calibration and environmental factors are critical in radar performance.

Analyzing Rainfall Estimation Errors in Hurricane Fran Using Radar Data
E N D
Presentation Transcript
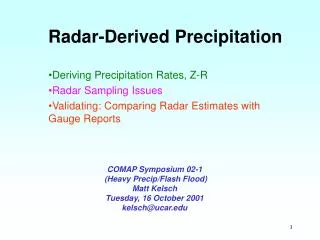
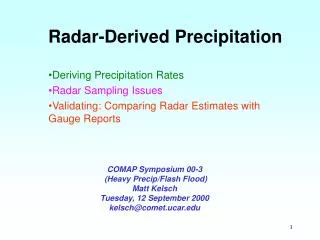
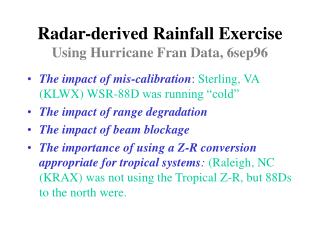
Radar-derived Rainfall ExerciseUsing Hurricane Fran Data, 6sep96 • The impact of mis-calibration:Sterling, VA (KLWX) WSR-88D was running “cold” • The impact of range degradation • The impact of beam blockage • The importance of using a Z-R conversion appropriate for tropical systems:(Raleigh, NC (KRAX) was not using the Tropical Z-R, but 88Ds to the north were.
Z-R RelationshipsWSR-88D default, Marshall-Palmer, and Tropical
Calibration Problems The following two reflectivity images are the 0.5-degree tilt at 1100 UTC 6sep96 from • Sterling, VA (KLWX) • Wakefield, VA (KAKQ) The triangle formed by stations CHO-EZF-OFP are about equal distances from either radar, but note the KLWX data is running ~5 dBZ lower in the more intense echoes.
Calibration Problems 1. What does this ~5 dBZ difference convert to in rainfall rate for the more intense echoes (remember this is tropical)? * Use the Z-R table on the second slide
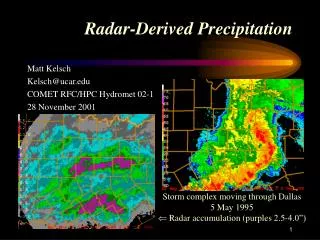
Range Degradation The following two 0.5-degree reflectivity images are from 0600 UTC, 6sep96 at: • Raleigh, NC (KRAX) • Blacksburg, VA (KFCX) Tropical systems characteristically have a large amount of precipitation production in the low levels. Thus, there may be difficulty sampling the precipitation as the radar beam gets higher in the atmosphere. Compare the radar imagery for the area around RAX (Raleigh-Durham).
Range Degradation 2. How much less magnitude is the KFCX radar showing compared to KRAX? What difference in hourly rainfall rate would there be? Again, use the table on the second slide.
Beam blockage The following is a 0.5-degree reflectivity image from Blacksburg, VA (KFCX) at 1200 UTC, 6sep96. A 1-hour radar loop confirms that the wedge of lower radar returns extending to the north-northeast of FCX is caused by terrain blocking.
Beam blockage 3. Estimate how much reflectivity is lost, and thus, how much impact might that have on the hourly rainfall rate?
Z-R Coefficients The following two images are Storm Total accumulation from the Raleigh, NC (KRAX) radar at 1159 UTC, 6sep96 • 1st image using the default WSR-88D Z=300R1.4 • 2nd image using the tropical Z=250R1.2 Ground reports suggest up to 9 inches fell in the Raleigh area.
Z-R Coefficients 4a. Which Z-R equation seemed to perform better? 4b. Are there other processes or error sources you need to consider? 5. Overall, could problems associated with calibration, beam blockage, or range degradation be at least as important as Z-R issues?