Download
1 / 1
20 likes | 264 Views
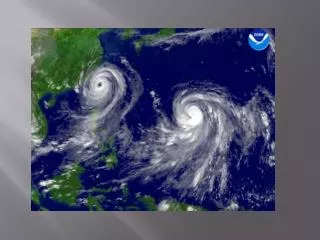
872 mb. 879 mb. 882 mb. Typhoon Gay (Western Pacific) 11/21/1992 00:00 UTC Strongest TC on Earth since 1979. Hurricane Wilma 10/19/2005 09:00 UTC Strongest TC in North Atlantic. 885 mb. Cyclone Daryl-Agnielle 11/21/1995 03:00 UTC Strongest TC in Indian Ocean. Cyclone Zoe

E N D
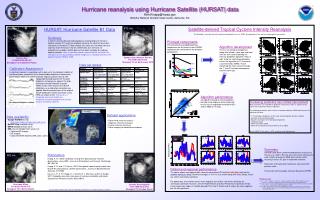
872 mb 879 mb 882 mb Typhoon Gay (Western Pacific) 11/21/1992 00:00 UTC Strongest TC on Earth since 1979 Hurricane Wilma 10/19/2005 09:00 UTC Strongest TC in North Atlantic 885 mb Cyclone Daryl-Agnielle 11/21/1995 03:00 UTC Strongest TC in Indian Ocean Cyclone Zoe 12/28/2002 03:00 UTC Strongest TC in Southern Pacific Hurricane reanalysis using Hurricane Satellite (HURSAT) data Ken.Knapp@noaa.gov NOAA’s National Climatic Data Center, Asheville, NC Satellite-derived Tropical Cyclone Intensity Reanalysis HURSAT: Hurricane Satellite B1 Data The following is an extension of the work presented by Kossin et al (2007) by expanding in time and investigating other parameters. Summary In light of recently documented hypotheses relating long-term trends in tropical cyclone (TC) activity and global warming, the need for consistent reanalyses of historical TC data records has taken on a renewed sense of urgency. Such reanalyses rely on satellite data, but until now, no comprehensive global satellite data set has been available for studying tropical cyclones. Here a new data record is presented that facilitates the reanalysis of TCs by providing satellite imagery in a standard format for the period of record 1978 to 2008. Principal components The azimuthally averaged brightness temperature for all storms in the HURSAT record can be used to derive the principal components. Algorithm development The first six principal components along with latitude, storm age and local time are then used to develop an intensity prediction algorithm. Plots at right show the normalized predictors versus the logarithm of TC maximum sustained winds (MSW). Those explaining the most variance include the 1st and 3rd principal components and the storm age. PC-1 PC-3 … PC-2 Data set details Calibration Assessment A significant concern in providing such a data set is the temporal stability of the observations, particularly the infrared window brightness temperature observations which are used to estimate tropical cyclone intensity. We independently calibrated the B1 infrared brightness temperatures against the High- resolution Infrared Radiation Sounder (HIRS). Errors were found in the ISCCP calibration, so a calibration correction was applied. Monthly comparisons of the original ISCCP calibration and the correction using HIRS are shown at left. The result is a temporally-consistent brightness temperature record appropriate for climate analysis of tropical cyclones. Before Before Before Algorithm performance An algorithm based on these predictors derived using stepwise linear regression results has an explained variance of 65% and an RMS of 17 knots. After • Increasing predictors has limited improvement • More parameters are available for predictors and can be used in a stepwise linear regression to determine the best algorithm. • The following parameters were used in an attempt to decrease RMS and increase the explained variance: • 1st 15 principal components of the mean azimuthal profile and the standard deviation of the azimuthal profile • Squares and Cubes of the principal components • Quadratic of age • Storm translation speed • Storm IR axisymmetry variance (Pineros et al, 2008) • Result: RMS=15.3 kt and r2 = 0.70, so only a small improvement. • Dataset applications • Storm wind structure analysis • Objective intensity reanalysis • Dvorak intensity reanalysis • Storm imagery for educational purposes • Data availability • Google HURSAT to find: • http://www.ncdc.noaa.gov/oa/rsad/hursat/ • NetCDF files available via ftp • MPEG movies of each storm • KML files for Google Earth access to: • Colorized IR imagery • BD Imagery • Colorized SSMI (following NRL color scales) N. Atl. W. Pac. E. Pac. Summary HURSAT data were used to extend previous analysis by Kossin et al. (2007). Results were consistent with previous work. Efforts to decrease RMS were not too fruitful, resulting in only a 5% gain in explained variance. Expansion of the period of record was consistent with previous work. Future work will investigate retrievals based on AVHRR. Normalized PDI S. Ind. S. Pac. Publications Knapp, K. R., 2008: Calibration of long-term geostationary infrared observations using HIRS. Journal of Atmospheric and Oceanic Technology, 25, 183-195. Knapp, K. R. and J. P. Kossin, 2007: New global tropical cyclone data from ISCCP B1 geostationary satellite observations. Journal of Applied Remote Sensing, 1, 013505 Kossin, J. P., K. R. Knapp, D. J. Vimont, R. J. Murnane, and B. A. Harper, 2007: A globally consistent reanalysis of hurricane variability and trends. Geophysical Research Letters, 34, L04815. N. Ind. Global and regional performance The above global and regional plots show the normalized PDI for best track data (red) and the satellite reanalysis (blue). Binomial averages (1-4-6-4-1) are shown along with linear trends, which are solid if statistically significant. For global data, the satellite trend is more negative, but neither it nor best track data are statistically significant. By basin, only the North Atlantic and East Pacific have significant trends. Linear regression slopes of satellite-derived PDI in the S. Pacific and S. Indian are more negative, but still not significant. References Kossin, J. P., K. R. Knapp, D. J. Vimont, R. J. Murnane, and B. A. Harper, 2007: A globally consistent reanalysis of hurricane variability and trends. Geophysical Research Letters, 34, L04815. Knapp, K. R. and J. P. Kossin, 2007: New global tropical cyclone data from ISCCP B1 geostationary satellite observations. Journal of Applied Remote Sensing, 1, 013505 Pineros, M. F., E. A. Ritchie, and J. S. Tyo, 2008: Objective measures of tropical cyclone structure and intensity change from remotely-sensed infrared image data. IEEE Trans. Geosciences and remote sensing. 46, 3574-3580. List of notable storms from: http://en.wikipedia.org/wiki/List_of_notable_tropical_cyclones