Download
1 / 1
10 likes | 107 Views
Habitat Mapping of the Falmouth Estuary u sing Geophysical Methods. By Group 11: Sian Crowley, Alex Hewitt, Foivi Kouraki, Sam Leach, Roisin Quinn, Robin Rigby, Cecilia Roos, Sally Stewart-Moore. 30 / 06 / 2012. Date: 30 / 06 / 2012 Weather: Sunny with showers

E N D
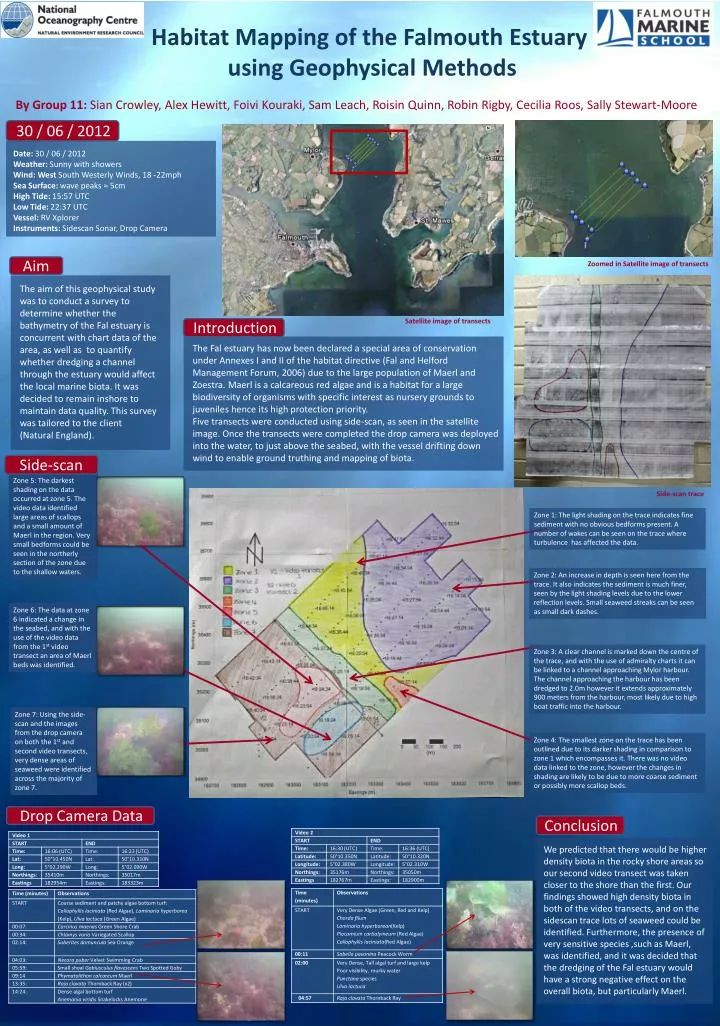
Habitat Mapping of the Falmouth Estuary using Geophysical Methods By Group 11: Sian Crowley, Alex Hewitt, Foivi Kouraki, Sam Leach, Roisin Quinn, Robin Rigby, Cecilia Roos, Sally Stewart-Moore 30 / 06 / 2012 Date: 30 / 06 / 2012 Weather: Sunny with showers Wind: West South Westerly Winds, 18 -22mph Sea Surface: wave peaks ≈ 5cm High Tide: 15:57 UTC Low Tide: 22:37 UTC Vessel: RV Xplorer Instruments: Sidescan Sonar, Drop Camera Zoomed in Satellite image of transects Aim The aim of this geophysical study was to conduct a survey to determine whether the bathymetry of the Fal estuary is concurrent with chart data of the area, as well as to quantify whether dredging a channel through the estuary would affect the local marine biota. It was decided to remain inshore to maintain data quality. This survey was tailored to the client (Natural England). Satellite image of transects Introduction The Fal estuary has now been declared a special area of conservation under Annexes I and II of the habitat directive (Fal and Helford Management Forum, 2006) due to the large population of Maerl and Zoestra. Maerl is a calcareous red algae and is a habitat for a large biodiversity of organisms with specific interest as nursery grounds to juveniles hence its high protection priority. Fivetransects were conducted using side-scan, as seen in the satellite image. Once the transects were completed the drop camera was deployed into the water, to just above the seabed, with the vessel drifting down wind to enable ground truthing and mapping of biota. Side-scan Zone 5: The darkest shading on the data occurred at zone 5. The video data identified large areas of scallops and a small amount of Maerl in the region. Very small bedforms could be seen in the northerly section of the zone due to the shallow waters. Side-scan trace Zone 1: The light shading on the trace indicates fine sediment with no obvious bedforms present. A number of wakes can be seen on the trace where turbulence has affected the data. Zone 2: An increase in depth is seen here from the trace. It also indicates the sediment is much finer, seen by the light shading levels due to the lower reflection levels. Small seaweed streaks can be seen as small dark dashes. Zone 6: The data at zone 6 indicated a change in the seabed, and with the use of the video data from the 1st video transect an area of Maerl beds was identified. Zone 3: A clear channel is marked down the centre of the trace, and with the use of admiralty charts it can be linked to a channel approaching Mylor harbour. The channel approaching the harbour has been dredged to 2.0m however it extends approximately 900 meters from the harbour, most likely due to high boat traffic into the harbour. Zone 7: Using the side-scan and the images from the drop camera on both the 1st and second video transects, very dense areas of seaweed were identified across the majority of zone 7. Zone 4: The smallest zone on the trace has been outlined due to its darker shading in comparison to zone 1 which encompasses it. There was no video data linked to the zone, however the changes in shading are likely to be due to more coarse sediment or possibly more scallop beds. Drop Camera Data Conclusion We predicted that there would be higher density biota in the rocky shore areas so our second video transect was taken closer to the shore than the first. Our findings showed high density biota in both of the video transects, and on the sidescan trace lots of seaweed could be identified. Furthermore, the presence of very sensitive species ,such as Maerl, was identified, and it was decided that the dredging of the Fal estuary would have a strong negative effect on the overall biota, but particularly Maerl.