Download
1 / 7
70 likes | 138 Views
Android is a Linux based operating system used for smart phone devices. Since 2008, Android devices gained huge market share due to its open architecture and popularity. Increased popularity of the Android devices and associated primary benefits attracted the malware developers. Rate of Android malware applications increased between 2008 and 2016. In this paper, we proposed dynamic malware detection approach for Android applications. In dynamic analysis, system calls are recorded to calculate the density of the system calls. For density calculation, we used two different lengths of system calls that are 3 gram and 5 gram. Furthermore, Naive Bayes algorithm is applied to classify applications as benign or malicious. The proposed algorithm detects malware using 100 real world samples of benign and malware applications. We observe that proposed method gives effective and accurate results. The 3 gram Naive Bayes algorithm detects 84 malware application correctly and 14 benign application incorrectly. The 5 gram Naive Bayes algorithm detects 88 malware application correctly and 10 benign application incorrectly. Mr. Tushar Patil | Prof. Bharti Dhote "Malware Detection in Android Applications" Published in International Journal of Trend in Scientific Research and Development (ijtsrd), ISSN: 2456-6470, Volume-3 | Issue-5 , August 2019, URL: https://www.ijtsrd.com/papers/ijtsrd26449.pdf Paper URL: https://www.ijtsrd.com/engineering/computer-engineering/26449/malware-detection-in-android-applications/mr-tushar-patil<br>

E N D
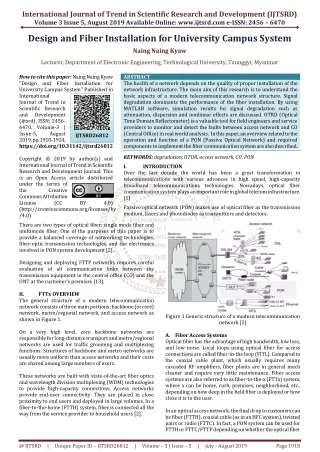
International Journal of Trend in Scientific Research and Development (IJTSRD) Volume 3 Issue 5, August 2019 Available Online: www.ijtsrd.com e-ISSN: 2456 – 6470 Design and Fiber Installation for University Campus System Naing Naing Kyaw Lecturer, Department of Electronic Engineering, Technological University, Taunggyi, Myanmar How to cite this paper: Naing Naing Kyaw "Design and Fiber Installation for University Campus System" Published in International Journal of Trend in Scientific Research and Development (ijtsrd), ISSN: 2456- 6470, Volume-3 | Issue-5, August 2019, pp.1918-1924, https://doi.org/10.31142/ijtsrd26812 Copyright © 2019 by author(s) and International Journal of Trend in Scientific Research and Development Journal. This is an Open Access article distributed under the terms of the Creative Commons Attribution License (CC (http://creativecommons.org/licenses/by /4.0) There are two types of optical fiber: single mode fiber and multimode fiber. One of the purposes of this paper is to provide a balanced coverage of networking technologies, fiber-optic transmission technologies, and the electronics involved in PON system development [2]. Designing and deploying FTTP networks requires careful evaluation of all communication links between the transmission equipment in the central office (CO) and the ONT at the customer’s premises [13]. II. FTTx OVERVIEW The general structure of a modern telecommunication network consists of three main portions: backbone (or core) network, metro/regional network, and access network as shown in Figure 1. On a very high level, core backbone networks are responsible for long-distance transport and metro/regional networks are used for traffic grooming and multiplexing functions. Structures of backbone and metro networks are usually more uniform than access networks and their costs are shared among large numbers of users. These networks are built with state-of-the-art fiber optics and wavelength division multiplexing (WDM) technologies to provide high-capacity connections. Access networks provide end-user connectivity. They are placed in close proximity to end users and deployed in large volumes. In a fiber-to-the-home (FTTH) system, fiber is connected all the way from the service provider to household users [2]. ABSTRACT The health of a network depends on the quality of proper installation of the network infrastructure. The main aim of this research is to understand the basic aspects of a modern telecommunication network structure. Signal degradation dominants the performance of the fiber installation. By using MATLAB software, simulation results for signal degradation such as attenuation, dispersion and nonlinear effects are discussed. OTRD (Optical Time Domain Reflectometer) is a valuable tool for field engineers and service providers to monitor and detect the faults between access network and CO (Central Office) in real world analysis. In this paper, an overview related to the operation and function of a PON (Passive Optical Network) and required components to implement the fiber communication system are also described. KEYWORDS: degradation, OTDR, access network, CO, PON I. INTRODUCTION Over the last decade the world has been a great transformation in telecommunications with various advances in high speed, high-capacity broadband telecommunications technologies. Nowadays, optical fiber communication system plays an important role in global telecom infrastructure. [1] Passive optical network (PON) makes use of optical fiber as the transmission medium, lasers and photodiodes as transmitters and detectors. IJTSRD26812 BY 4.0) Figure 1 Generic structure of a modern telecommunication network [2] A.Fiber Access Systems Optical fiber has the advantage of high bandwidth, low loss, and low noise. Local loops using optical fiber for access connections are called fiber-in-the loop (FITL). Compared to the coaxial cable plant, which usually requires many cascaded RF amplifiers, fiber plants are in general much cleaner and require very little maintenance. Fiber access systems are also referred to as fiber-to-the-x (FTTx) system, where x can be home, curb, premises, neighborhood, etc., depending on how deep in the field fiber is deployed or how close it is to the user. In an optical access network, the final drop to customers can be fiber (FTTH), coaxial cable (as in an HFC system), twisted pairs or radio (FTTC). In fact, a PON system can be used for FTTH or FTTC/FTTP depending on whether the optical fiber @ IJTSRD | Unique Paper ID – IJTSRD26812 | Volume – 3 | Issue – 5 | July - August 2019 Page 1918
International Journal of Trend in Scientific Research and Development (IJTSRD) Journal of Trend in Scientific Research and Development (IJTSRD) @ www.ijtsrd.com www.ijtsrd.com eISSN: 2456-6470 termination (or the ONU location) is at the user, or in a neighborhood and extended through copper or radio links to the user [2]. B.Passive Optical Networks In a PON there are no active components between the central office and the customer’s premises.. The three main PON alternatives are known as broadband PON (BPON), Ethernet PON (EPON), and gigabit PON (GPON). Table 1 Major PON Technologies and Their Characteristics termination (or the ONU location) is at the user, or in a neighborhood and extended through copper or radio links to The simulation area is chosen at the distances 1.6 km and 3.1 km. OTDR test is made at Fiber Optic Terminal Box (OTB). Most single mode fibers have a loss factor of between 0.25dB/km at 1550 nm and 0.35dB/km at 1310 nm. Fusion splice loss is calculated at 0.1 dB per splice for 1310 nm sources. For each connector, 0.75 dB loss is used for fusion splice on connectors. Most system designers add a loss budget margin of 3 to 10 dB. The simulation area is chosen at the distances 1.6 km and 3.1 km. OTDR test is made at Fiber Optic Terminal Box (OTB). Most single mode fibers hav 0.25dB/km at 1550 nm and 0.35dB/km at 1310 nm. Fusion splice loss is calculated at 0.1 dB per splice for 1310 nm sources. For each connector, 0.75 dB loss is used for fusion splice on connectors. Most system designers add a loss budget margin of 3 to 10 dB. Link Loss = [fiber length (km loss ×number of splices ×number of connectors) By using the above link loss equation, an estimated 6.24 dB of power would be required to transmit across this link [14]. The maximum distance of a particular fiber optic link can be estimated by using the following equations: Fiber Length = (Optical bu loss/km) Fiber Length = {(mint power) loss ×number of splices) number of connectors) (Fiber loss/km) In this installation a fast Ethernet single mode link at nm with 2 connector pairs and 5 splices are used. So, min.TX power-RX sensitivity= Splice loss × number of splices = 0.1 dB×5= 0.5dB Connector loss × number of connectors = 0.75dB×2 = 1.5dB Safety margin = 3.0dB Fiber loss/km = 0.4 dB/km Fiber Length = {(6.24dB) (0.4 DB) = 3.1km End-to-end tests of fiber optic cable loss include the losses caused by splices. If the cable loss exceeds the calculated maximum value, test the cable with an OTDR to analyze the loss of individual components (fiber, connectors, and splices) in the cable. Required components for installation from CO to a university campus network are described in the next section. IV. ACCESS NETWORK FOR A UNI Access networks have been traditionally called last networks as they comprise the last segment connection from service providers’ central office (CO) to end users. Figure 3 shows an access network which consists of local mikrotik CCR1036-8G-2S+ firewall router, cisco Catalysts 3550 series layer 3 switch and fiber media converter FT Ethernet cable based University campus system. Ethernet cable based University campus system. active components between the central office and the customer’s premises.. The three main PON alternatives are known as broadband PON (BPON), Ethernet PON (EPON), and gigabit PON (GPON). km) x fiber loss per km] + (splice ×number of splices) + (connector loss connectors) + (safety margin) Major PON Technologies and Their By using the above link loss equation, an estimated 6.24 dB of power would be required to transmit across this link [14]. The maximum distance of a particular fiber optic link can be estimated by using the following equations: = (Optical budget - Link loss) ÷ (Fiber power) -(RX sensitivity)- (splice ×number of splices)- (connector loss of connectors) - (safety margin)}÷ (Fiber loss/km) An architecture consisting of point-to-point Ethernet links is a competing access network technology. Ethernet use in access networks is referred to as Ethernet- (EFM). Some of the characteristics of each methodology and the standards to which they adhere are listed in Table 1 [13]. III. DESIGN CONSIDERATIONS INSTALLATION Network layout considerations within the CO include where to place the WDM coupler that combines the triple services, minimizing the number of connector interfaces allowing flexibility in connecting both FTTP and non services to available fibers in the feeder cables. Installing the outside cable plant (OSP) is a major expense of an FTTP implementation [13]. point Ethernet links a competing access network technology. Ethernet use in -in-the-first-mile (EFM). Some of the characteristics of each methodology and h they adhere are listed in Table 1 [13]. In this installation a fast Ethernet single mode link at 1310 nm with 2 connector pairs and 5 splices are used. So, RX sensitivity= -0.8dB-(-7.04dB) = 6.24dB loss × number of splices = 0.1 dB×5= 0.5dB loss × number of connectors = 0.75dB×2 = 1.5dB DESIGN CONSIDERATIONS FOR FOR FIBER FIBER Network layout considerations within the CO include where to place the WDM coupler that combines the triple-play services, minimizing the number of connector interfaces, and allowing flexibility in connecting both FTTP and non-FTTP services to available fibers in the feeder cables. Installing the (OSP) is a major expense of an FTTP = 0.4 dB/km ) - (0.5dB) - (1.5dB) - (3.0dB)} ÷ 3.1km end tests of fiber optic cable loss include the losses caused by splices. If the cable loss exceeds the calculated test the cable with an OTDR to analyze the loss of individual components (fiber, connectors, and splices) in the cable. Required components for installation from CO to a university campus network are described in the next ACCESS NETWORK FOR A UNIVERSITY Access networks have been traditionally called last-mile networks as they comprise the last segment connection from service providers’ central office (CO) to end users. Figure 3 shows an access network which consists of local mikrotik + firewall router, cisco Catalysts 3550 series layer 3 switch and fiber media converter FT-806A20 for Figure 2 Design of FTTx for Electronic Engineer Department of Technological University (Taunggyi) Department of Technological University (Taunggyi) Figure 2 Design of FTTx for Electronic Engineering The red line in Figure 2 represents the overhead installation and the black line refers to aerial installation where electrical poles are used to carry fiber cables. The optical splitter splits the power of signal that is each fiber entering the splitter into a given number of fibers. Fiber Optic Terminal Box (OTB) is mounted to inside and outside of building to distribute and connect optical cable for distribution of subscribers. It supports terminatio and storage functions for fiber cable. It has excellent performance for aerial installation and it can be installed rapidly and easily in the field. The type of cable choosing from CO to the University is G 652.Csingle mode fiber. It is optimized for operation in the 1310 nm and 1550 nm wavelengths with zero 1310 nm and 1550 nm wavelengths with zero-dispersion. The red line in Figure 2 represents the overhead installation and the black line refers to aerial installation where electrical poles are used to carry fiber cables. The optical er of signal that is each fiber entering the splitter into a given number of fibers. Fiber Optic Terminal Box (OTB) is mounted to inside and outside of building to distribute and connect optical cable for distribution of subscribers. It supports termination, splicing and storage functions for fiber cable. It has excellent performance for aerial installation and it can be installed The type of cable choosing from CO to the University is G- single mode fiber. It is optimized for operation in the Figure 3 University access network Figure 3 University access network @ IJTSRD | Unique Paper ID – IJTSRD26812 26812 | Volume – 3 | Issue – 5 | July - August 2019 August 2019 Page 1919
International Journal of Trend in Scientific Research and Development (IJTSRD) @ www.ijtsrd.com eISSN: 2456-6470 They are also called first-mile networks in recent years as they are the first segment of the broader network seen by users of telecommunication services. Traditionally, optical fibers have been widely used in backbone networks because of their huge available bandwidth and very low loss [2]. A.WDM in Optical Access Networks The basis of wavelength division multiplexing (WDM) is to use multiple sources operating at slightly different wavelength to transmit several independent streams simultaneously over the same fiber. Figure 4 shows the basic WDM concept [3]. WDM increases system capacity by transmitting multiple wavelengths on a single fiber. Coarse WDM techniques have already been applied in PON systems to separate upstream and downstream signals, and provide analog video overlay. An important advantage of the optical fiber is its virtually unlimited bandwidth from an access viewpoint. Coarse WDM overlay on a power-splitting PON is an obvious way to provide different services and increase system capacity [2]. Figure 6 Media converter A fiber media converter is a simple networking device that makes it possible to connect two dissimilar media types such as twisted pair with fiber optic cabling. They are important in interconnecting fiber optic cabling-based systems with existing copper-based, structured cabling systems. They are also used in metropolitan area network (MAN) access and data transport services to enterprise customers [9]. Figure 6 shows a Fast Ethernet bridge fiber converter (10/100BASE- TX to 100BASE-FX). C.Splicing Splicing in fiber optics as shown in Figure 7 is the physical joining of two separate optical fibers with the goal of having 100-percent signal transfer. Splicing connections are meant to be permanent, non-reconfigurable connections. There are two basic splicing methods in use today: mechanical and fusion splice. Figure 4 Basic concept of wavelength division multiplexing Dense Wavelength Division Multiplexing (DWDM) module depicted in Figure 5 is an optical multiplexing technology used to increase bandwidth over existing fiber networks. DWDM works by combining and transmitting multiple signals simultaneously at different wavelengths on the same fiber. The technology creates multiple virtual fibers, thus multiplying the capacity of the physical medium [7]. Figure 7 Fiber Splicing Mechanical splicing involves the use of an alignment fixture to bring and hold two fibers in alignment. Mechanical splices typically give insertion loss values of <0.15dB with return loss values of >35dB and involve the use of an index- matching gel. Fusion splicing as shown in Figure 8 uses an electric arc to “weld” two fibers together. Fusion splices typically have insertion loss values of <0.05dB and return loss values of >70dB. Whichever splicing type is used, the ODF needs to provide a location to store and protect the splices. Figure 5 DWDM module B.Media Converter A media converter, in the context of network hardware, is a cost-effective and flexible device intended to implement and optimize fiber links in every kind of network. Among media converters, the most often used type is a device that works as a transceiver, which converts the electrical signal utilized in copper unshielded twisted pair (UTP) network cabling to light waves used for fiber optic cabling. A media converter offers fiber-to-fiber conversion as well, from multi-mode fiber into single-mode fiber. It also converts a dual fiber link to single fiber with the help of bi-directional (BIDI) data flow. [8] Figure 8 Fusion splicing @ IJTSRD | Unique Paper ID – IJTSRD26812 | Volume – 3 | Issue – 5 | July - August 2019 Page 1920
International Journal of Trend in Scientific Research and Development (IJTSRD) Journal of Trend in Scientific Research and Development (IJTSRD) @ www.ijtsrd.com www.ijtsrd.com eISSN: 2456-6470 When fusion splicing is done, the alignment of two connecting fibers can be observed on the screen as depicted in Figure 9. When fusion splicing is done, the alignment of two connecting fibers can be observed on the screen as depicted Figure 11 shows EPON OLT FD 2000S which can be applied to Fiber to the Building / Point / Home (FTTB/ FTTP/FTT H) Access solution. F.Optical Network Unit FTTH FD204HW ONU as shown in Figure 12 is a broadband access device and can be used with OLT FD2000S to build a system EPON. Figure 11 shows EPON OLT FD 2000S which can be applied / Point / Home (FTTB/ FTTP/FTT FTTH FD204HW ONU as shown in Figure 12 is a broadband access device and can be used with OLT FD2000S to build a Figure 12 EPON ONU FD204HW Figure 12 EPON ONU FD204HW V. Signal attenuation is one of the most important properties of an optical fiber, because it largely determines the maximum repeaterless separation between a transmitter and a receiver. Of equal importance is signal distortion. The distortion causes the optical signal pulses to broaden as they travel along a fiber. The signal distortion mechanisms thus limit the information carrying capacity of a fiber. The basic attenuation mechanisms in a fiber are absorption, scattering, and radiation losses of the optical energy. Absorption is related to the fiber material, whereas scattering is associated both with the fiber material and with structural imperfections in the optical Waveguide [3]. A.Attenuation Attenuation of a light signal as it propagates an important consideration in the design of an optical communication system, since it plays a major role in determining the maximum transmission distance between a transmitter and a receiver. Figure 13 illustrates the relationship of wav attenuation of optical fiber. As channel attenuation largely determined the maximum transmission distance prior to signal restoration, optical fiber communications became especially attractive when the transmission losses of fibers were reduced below those of the competing metallic conductors (less than 5 dB km conductors (less than 5 dB km−1) [4]. SIGNAL DEGRADATION IN SIGNAL DEGRADATION IN OPTICAL FIBERS Signal attenuation is one of the most important properties of an optical fiber, because it largely determines the maximum repeaterless separation between a transmitter and a receiver. Of equal importance is signal distortion. The causes the optical signal pulses to broaden as they Figure 9 Monitoring fiber alignments alignments D.Optical Distribution Frame An Optical Distribution Frame (ODF) is a frame used to provide cable interconnections between communication facilities, which can integrate fiber splicing, fiber termination, fiber optic adapters and connectors and cable connections together in a single unit. It can also work as a protective device to protect fiber optic connections from damage. According to the structure, ODFs can mainly be divided into three types, namely wall mount ODF, mount ODF and rack mount ODF. Figure 10 shows the wall mount ODF [6]. An Optical Distribution Frame (ODF) is a frame used to provide cable interconnections between communication facilities, which can integrate fiber splicing, fiber adapters and connectors and cable connections together in a single unit. It can also work as a protective device to protect fiber optic connections from damage. According to the structure, ODFs can mainly be divided into three types, namely wall mount ODF, floor mount ODF and rack mount ODF. Figure 10 shows the wall The signal distortion mechanisms thus limit the information carrying capacity of a fiber. The basic attenuation mechanisms in a fiber are absorption, scattering, and s of the optical energy. Absorption is related to the fiber material, whereas scattering is associated both with the fiber material and with structural imperfections in Attenuation of a light signal as it propagates along a fiber is an important consideration in the design of an optical communication system, since it plays a major role in determining the maximum transmission distance between a Figure 13 illustrates the relationship of wavelength and attenuation of optical fiber. As channel attenuation largely determined the maximum transmission distance prior to signal restoration, optical fiber communications became especially attractive when the transmission losses of fibers below those of the competing metallic Figure 10 Wall mounts Optical Distribution Frame Figure 10 Wall mounts Optical Distribution Frame E.Optical Line Terminal An optical line terminal (OLT) is the device which serves as the service provider endpoint of a passive o Network (PON). The OLT is located in a central office and controls the bidirectional flow of information across the ODN. In the downstream direction the function of the OLT is to take in voice, data, and video traffic from a long network and broadcast it to all the ONT modules on the ODN. In the upstream direction, OLT accepts and distributes all the traffic from the network users [13]. An optical line terminal (OLT) is the device which serves as the service provider endpoint of a passive optical Network (PON). The OLT is located in a central office and controls the bidirectional flow of information across the ODN. In the downstream direction the function of the OLT is to take in voice, data, and video traffic from a long-hual roadcast it to all the ONT modules on the ODN. In the upstream direction, OLT accepts and distributes all the Figure.13 Optical fiber attenuation re.13 Optical fiber attenuation[3] Figure 11 EPON OLT FD2000S Figure 11 EPON OLT FD2000S @ IJTSRD | Unique Paper ID – IJTSRD26812 26812 | Volume – 3 | Issue – 5 | July - August 2019 August 2019 Page 1921
International Journal of Trend in Scientific Research and Development (IJTSRD) Journal of Trend in Scientific Research and Development (IJTSRD) @ www.ijtsrd.com www.ijtsrd.com eISSN: 2456-6470 B.Dispersion Dispersion of the transmitted optical signal causes distortion for both digital and analog transmission along optical fibers. for both digital and analog transmission along optical fibers. single-mode fiber. The small core diameters, together with the long transmission distances that may be o these fibers, have enabled the occurrence of nonlinear phenomena at power levels of a few milliwatts which are well within the capability of semiconductor lasers. Furthermore, the optical power levels become much larger when wavelength division multiplexing packs many signal channels into one single-mode fiber such that the overall power level is the summation of the individual channel optical powers. [4] VI. OPTICAL FIBER CABLE INSTALLATIONS Before installation, site survey should be done to re circumstances or locations in need of special attention. A cable pulling plan is also necessary because part of pulling tension can impact performance of the system process. Fiber optic cables are designed to withstand bending both during installation where tension is applied to the cable and after installation. During pulling stage, fiber bending should not exceed the cable bend radius because fiber optic cable can be broken when kinked or bent too tightly. The installation of optical fiber cable ducts, undersea, or buried directly in the ground, as Figure 15 illustrates. As a result of installation and/or manufacturing limitations, individual cable lengths will range from several hundred meters to several kilometers for long distance applications. mode fiber. The small core diameters, together with the long transmission distances that may be obtained with these fibers, have enabled the occurrence of nonlinear phenomena at power levels of a few milliwatts which are well within the capability of semiconductor lasers. Dispersion of the transmitted optical signal causes distortion Furthermore, the optical power levels become much larger ion multiplexing packs many signal mode fiber such that the overall power level is the summation of the individual channel OPTICAL FIBER CABLE INSTALLATIONS Before installation, site survey should be done to recognize circumstances or locations in need of special attention. A cable pulling plan is also necessary because part of pulling tension can impact performance of the system process. Fiber optic cables are designed to withstand bending both tion where tension is applied to the cable and after installation. During pulling stage, fiber bending should not exceed the cable bend radius because fiber optic cable can be broken when kinked or bent too tightly. Figure14. Dispersion (a) fiber input;(b) Fiber distance L1;(c) fiber output at a distance 1;(c) fiber output at a distance L2 > L1 [4] Fiber output at a The installation of optical fiber cables can be either aerial, in ducts, undersea, or buried directly in the ground, as Figure 15 illustrates. As a result of installation and/or manufacturing limitations, individual cable lengths will range from several hundred meters to several kilometers for When considering the major implementation of optical fiber transmission which involves some form of digital modulation, then dispersion mechanisms within the fiber cause broadening of the transmitted light pulses as they travel along the channel. There is an illustration using the digital bit pattern 1011 of the broadening of light pulses as they are transmitted along a fiber. This phenomenon is illustrated in Figure 14, where it may be observed that each pulse broadens and overlaps with its neighbors, eventually becoming indistinguishable at the receiver input. The effect is known as inter interference (ISI). Thus an increasing number of errors may be encountered on the digital optical channel as the ISI becomes more pronounced. The error rate is also a function of the signal attenuation on the link and the subsequent signal ratio (SNR) at the receiver. C.Nonlinear effects Usually light waves or photons transmitted through a fiber have little interaction with each other, and are not changed by their passage through the fiber (except for absorption and scattering). There are exceptions, however, arising from the interactions between light waves and the material transmitting them, which can affect optical signals. These processes are normally referred to as nonlinear effects or phenomena because their strength typically depends on the square (or some higher power) of the optical intensity. Hence nonlinear effects are weak at low powers but they can become much stronger at high optical intensities. This situation can result either when the power is increased, or when it is concentrated in a small area such as the core o single-mode optical fiber. Although the nonlinear effects in optical fibers are small, they accumulate as light passes through many kilometers of they accumulate as light passes through many kilometers of When considering the major implementation of optical fiber transmission which involves some form of digital chanisms within the fiber cause broadening of the transmitted light pulses as they travel along the channel. There is an illustration using the digital bit pattern 1011 of the broadening of light pulses as phenomenon is illustrated in Figure 14, where it may be observed that each pulse broadens and overlaps with its neighbors, eventually becoming indistinguishable at the receiver input. The effect is known as inter symbol ing number of errors may be encountered on the digital optical channel as the ISI becomes more pronounced. The error rate is also a function of the signal attenuation on the link and the subsequent signal-to-noise Usually light waves or photons transmitted through a fiber have little interaction with each other, and are not changed by their passage through the fiber (except for absorption and scattering). There are exceptions, however, arising from the actions between light waves and the material transmitting them, which can affect optical signals. Figure 15 Types of installation of optical fiber cables [3] Figure 15 Types of installation of optical fiber cables [3] These processes are normally referred to as nonlinear effects or phenomena because their strength typically depends on The Optical line terminal (OLT) is the main element of the network and it is usually placed in the local exchange (Central Office). In this thesis, aerial fiber installation is used. Aerial fiber installation is cheaper than the underground fiber installation. Aerial fiber installations are one of the most cost effective methods for installing fiber cables rather than digging up roads, operators can simply use existing pole infrastructure roads, operators can simply use existing pole infrastructure The Optical line terminal (OLT) is the main element of the network and it is usually placed in the local exchange (Central Office). In this thesis, aerial fiber installation is used. Aerial fiber installation is cheaper than the underground the optical intensity. Hence nonlinear effects are weak at low powers but they can become much stronger at high optical intensities. This situation can result either when the power is increased, or when it is concentrated in a small area such as the core of a Aerial fiber installations are one of the most cost effective methods for installing fiber cables rather than digging up Although the nonlinear effects in optical fibers are small, @ IJTSRD | Unique Paper ID – IJTSRD26812 26812 | Volume – 3 | Issue – 5 | July - August 2019 August 2019 Page 1922
International Journal of Trend in Scientific Research and Development (IJTSRD) Journal of Trend in Scientific Research and Development (IJTSRD) @ www.ijtsrd.com www.ijtsrd.com eISSN: 2456-6470 to deploy the cables. Aerial fiber installation is reliable and flexible at most 5.5 km. The poles are placed at each 50 ft (15.24 m). After the link is installed, it needs testing from end to end. The end-to-end loss as illustrate in Figure 16 includes the connectors on each end, the loss of the fiber in each link, the connectors or splices on the splitter and the loss of the splitter itself [14]. to deploy the cables. Aerial fiber installation is reliable and xible at most 5.5 km. The poles are placed at each 50 ft (15.24 m). After the link is installed, it needs testing from end loss as illustrate in Figure 16 includes the connectors on each end, the loss of the fiber in onnectors or splices on the splitter and the Figure 19 Dispersion effects at 1.6 km distance from local exchange exchange Figure 19 Dispersion effects at 1.6 km distance from local Figure 20 Dispersion effects at 3.1 km distance at TU (Taunggyi) (Taunggyi) Figure 20 Dispersion effects at 3.1 km distance at TU Figure 16 Types of losses in installing optical fiber cables Figure 16 Types of losses in installing optical fiber cables VII. Simulation results for performance in optical fiber installation concern with attenuation, d nonlinearity are discussed in this section. The data signal in a single mode optical fiber link is simulated by using MATLAB software. In the simulation Gaussian pulse has taken as an input signal and studies all effects that change its shape due to attenuation, dispersion and nonlinearly. In first simulation, the output is taken at a distance 1.6 km, while in second simulation, the output is taken at 3.1 km. Figures 17 to 22, illustrate the effects of attenuation, dispersion, and nonlinearity of the fiber for the two distance. SIMULATION RESULTS Simulation results for performance in optical fiber installation concern with attenuation, dispersion and The data signal in a single mode optical fiber link is In the simulation Gaussian pulse has taken as an input signal and studies all effects that change its shape due to attenuation, dispersion Figure 21 Nonlinear effects at 1.6 km distance from local exchange exchange Figure 21 Nonlinear effects at 1.6 km distance from local In first simulation, the output is taken at a distance 1.6 km, put is taken at 3.1 km. Figures 17 to 22, illustrate the effects of attenuation, dispersion, and nonlinearity of the fiber for the two distance. Figure 22 Nonlinear effects at 3.1 km distance at TU (Taunggyi) It is clear that from the above results the attenuation, the dispersion and nonlinearly effects increase when the distance of communication through the fiber optics is increase. Therefore, repeaters are nece distances fiber optic systems when the signals are very weak. near effects at 3.1 km distance at TU (Taunggyi) It is clear that from the above results the attenuation, the dispersion and nonlinearly effects increase when the distance of communication through the fiber optics is increase. Therefore, repeaters are necessary for long- distances fiber optic systems when the signals are very Figure17 Attenuation effects at 1.6 km distance from local exchange Figure17 Attenuation effects at 1.6 km distance from local Figure18. Attenuation effects at 3.1 km distance at TU (Taunggyi) km distance at TU Figure 23 Output using ideal amplifier Figure 23 Output using ideal amplifier @ IJTSRD | Unique Paper ID – IJTSRD26812 26812 | Volume – 3 | Issue – 5 | July - August 2019 August 2019 Page 1923
International Journal of Trend in Scientific Research and Development (IJTSRD) Journal of Trend in Scientific Research and Development (IJTSRD) @ www.ijtsrd.com www.ijtsrd.com eISSN: 2456-6470 Figure 26 OTDR test at 3.1 km distance from local exchange exchange Figure 26 OTDR test at 3.1 km distance from local IX. Designing and planning are the first stage for implemen network system. The second stage is to choose proper equipments and follow the instructions in cable installation. In the final stage, quality and performance of the entire system must be tested. In this research, most of the components used in modern communication system are discussed. Signal degradations which are mostly dominant on performance level are also described. By observing OTRD testing results, it can be concluded that the overall performance of the optical link is in good condition. ACKNOWLEDGMENT The author wishes to express her heartfelt thanks to her parents U Kyaw Thaung and Daw Mya Nyunt for their noble support throughout her life. The author would also like to express her deepest gratitude to all teachers who taught her everything from childhood till now and to her student Mon Myat Thu who helped her collecting the required data. REFERENCES [1]C. Lin, “Broadband – Optical Access Networks and Fiber-To-The-Home”, England : John Wiley & Sons Ltd,2006. [2]C. F. Lam, “passive optical practice”, Elsevier Inc, 2007. [3]G. Keiser, “Optical Fiber Communication”, Second edition, McGraw-Hill, Inc, 1991. [4]J. M. Senior, “Optical Fiber Communications Principles and Practice”, Third edition, [5]Commscope, “Fundamentals Management”, white paper [6]https://community.fs.com/blog/basic icaldistribution frameodf.html [7]https://www.advaoptical.com/en/products/technolog y/ dwdm [8]https://www.techopedia.com/definition/20651/me aconverter-network-hardware [9]https://en.wikipedia.org/wiki/Fibermediaconverter [10][https://upload.wikimedia.org/wikipedia/commons /08 /OTDR-Yokogawa_AQ7270_ [11]https://community.fs.com/blog/understandingotdrde ad-zone-specifications.html [12]https://www.viavisolutions.com/en us/workingprinciple-chara [13]G. Keiser, “FTTX Concepts and Applications”, & Sons Ltd, 2006. [14]https://www.thefoa.org [15]https://www.mikrotik.com. https://www.mikrotik.com. CONCLUSION Designing and planning are the first stage for implementing a network system. The second stage is to choose proper equipments and follow the instructions in cable installation. In the final stage, quality and performance of the entire system must be tested. In this research, most of the rn communication system are discussed. Signal degradations which are mostly dominant on performance level are also described. By observing OTRD testing results, it can be concluded that the overall performance of the optical link is in good condition. Figure 24 Output using amplifier and filter Figure 24 Output using amplifier and filter Optical in-line amplifiers as shown in Figure 23 and 24 must be used as the repeaters for compensating the attenuation affects. The amplifiers and noise are dependent, so it is necessary to use filters after the amplification of the signal. Filter removes the effects of noise. VIII. ANALYSIS RESULT Optical Time Domain Reflectometers (OTDRs) can be used to test the performance of newly installed fiber links and detect problems that may exist in them. Its purpose is to detect, locate, and measure elements at any location on a fiber optic link. Simply by connecting one end of the fiber, calculate fiber attenuation, uniformity, splice and connector losses, then provides pictorial trace signatures [11]. Testing of OTDR is performed by transmitting and analyzing pulsed laser light traveling through an optical fiber. The measurement is said to be unidirectional as the light is insert at extremity of a fiber optic cable link. Using information obtained from the re signature reflected or scattered back to the point of origin, the OTDR acts as an optical radar system, providing the user with detailed information on the location and overall condition of splices, connections, defects and other features of interest. Figure 25 shows an example image for a OTRD result [12]. line amplifiers as shown in Figure 23 and 24 must compensating the attenuation affects. The amplifiers and noise are dependent, so it is necessary to use filters after the amplification of the signal. (OTDRs) can be used to test the performance of newly installed fiber links and detect Its purpose is to detect, The author wishes to express her heartfelt thanks to her parents U Kyaw Thaung and Daw Mya Nyunt for their noble support throughout her life. The author would also like to express her deepest gratitude to all teachers who taught her from childhood till now and to her student Mon Myat Thu who helped her collecting the required data. locate, and measure elements at any location on a fiber optic link. Simply by connecting one end of the fiber, OTDR can calculate fiber attenuation, uniformity, splice and connector losses, then provides pictorial trace signatures [11]. of OTDR is performed by transmitting and analyzing pulsed laser light traveling through an optical fiber. The measurement is said to be unidirectional as the light is insert Optical Access Networks and Home”, England : John Wiley & Sons Using information obtained from the resultant light signature reflected or scattered back to the point of origin, the OTDR acts as an optical radar system, providing the user with detailed information on the location and overall condition of splices, connections, defects and other features interest. Figure 25 shows an example image for a OTRD C. F. Lam, “passive optical networks: principles and practice”, Elsevier Inc, 2007. G. Keiser, “Optical Fiber Communication”, Second Hill, Inc, 1991. J. M. Senior, “Optical Fiber Communications Principles edition, Pearson, 2009. mentals white paper. https://community.fs.com/blog/basic-of- frameodf.html https://www.advaoptical.com/en/products/technolog of of Fiber Fiber Cable Cable https://www.techopedia.com/definition/20651/medi hardware https://en.wikipedia.org/wiki/Fibermediaconverter https://upload.wikimedia.org/wikipedia/commons/0 Yokogawa_AQ7270_-_1.jpg https://community.fs.com/blog/understandingotdrde specifications.html https://www.viavisolutions.com/en- characteristics-otdrs FTTX Concepts and Applications”, JohnWiley Figure 25 Example of OTDR testing result Figure 25 Example of OTDR testing result The distance between local exchange to TU (Taunggyi) is approximately 3.1 km. For this distance, simulation test has to be implemented before installation. After installation, the losses must be tested by OTDR. The result for real world analysis is shown in Figure 26. The distance between local exchange to TU (Taunggyi) is approximately 3.1 km. For this distance, simulation test has nstallation. After installation, the losses must be tested by OTDR. The result for real world .thefoa.org @ IJTSRD | Unique Paper ID – IJTSRD26812 26812 | Volume – 3 | Issue – 5 | July - August 2019 August 2019 Page 1924