Download
1 / 4
40 likes | 61 Views
There are various tools present commercially for automatic counting of Blood Cells. These tools are used for counting and finding the different types of Blood Cells present in the Blood Smear. The count of White Blood Cells is important for detecting various diseases as well as to follow the accurate treatment for the diseases like Anemia, Leukemia, Inflammation, Systemic illness, Allergy and Burn Induced etc. The White Blood Cell count gives the vital information about the disease's which is used for diagnosing the patients. The old conventional method of counting White Blood Cells under microscope gives an inaccurate and unreliable results depending upon how the laboratory technician works on it. Another method for White Blood Cell counting is done through cell counter machine, which is very expensive and cannot be afforded to remote rural areas, hence to overcome such problems this paper proposes a cost effective approach, i.e, automated solution using smart phone based solution for extracting and counting of White Blood Cells. Chaya P "An Automated Solution for Extracting and Counting of White Blood Cells in a Blood Smear Images" Published in International Journal of Trend in Scientific Research and Development (ijtsrd), ISSN: 2456-6470, Volume-3 | Issue-2 , February 2019, URL: https://www.ijtsrd.com/papers/ijtsrd20293.pdf Paper URL: https://www.ijtsrd.com/engineering/information-technology/20293/an-automated-solution-for-extracting-and-counting-of-white-blood-cells-in-a-blood-smear-images/chaya-p<br>

E N D
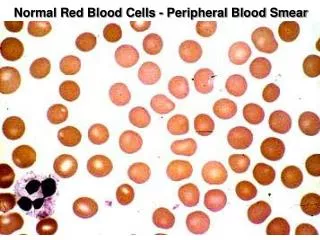
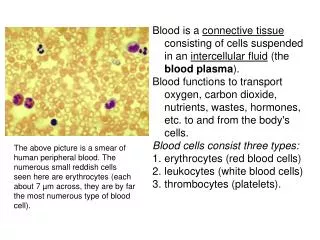
International Journal of Trend in Scientific Research and Development (IJTSRD) Volume: 3 | Issue: 2 | Jan-Feb 2019 Available Online: www.ijtsrd.com e-ISSN: 2456 - 6470 An Automated Solution for Extracting and Counting of White Blood Cells in a Blood Smear Images Chaya P Assistant Professor, Department of Information Science and Engineering, GSSSIETW, Mysuru, Karnataka, India ABSTRACT There are various tools present commercially for automatic counting of Blood Cells. These tools are used for counting and finding the different types of Blood Cells present in the Blood Smear. The count of White Blood Cells is important for detecting various diseases as well as to follow the accurate treatment for the diseases like Anemia, Leukemia, Inflammation, Systemic illness, Allergy and Burn-Induced etc. The White Blood Cell count gives the vital information about the disease’s which is used for diagnosing the patients. The old conventional method of counting White Blood Cells under microscope gives an inaccurate and unreliable results depending upon how the laboratory technician works on it. Another method for White Blood Cell counting is done through cell counter machine, which is very expensive and cannot be afforded to remote/rural areas, hence to overcome such problems this paper proposes a cost-effective approach, i.e, automated solution using smart phone based solution for extracting and counting of White Blood Cells. KEYWORDS: Blood Smear Image, Contour, OPENCV, Smart Phone, White Blood Cell I. INTRODUCTION The analysis of microscopic images is acutely important in both the medical and the computer/information science fields. Many research issues are related to the analysis of microscopic images, such as Complete Blood Cell (CBC) tests and the analysis of blood smears, which is considered the first step in detecting and diagnosing Anemia, Leukemia, and Malaria. Also, during a complete physical exam a series of tests are performed. One of these tests is the CBC, which is used to evaluate the composition and concentration of the cellular blood components. The CBC determines red blood cells (RBC) counts, white blood cell (WBC) counts, platelet counts, hemoglobin (HB) measurements, and mean red blood cell volume. In this paper, we have focused on White Blood Cell as these cells provide major defense system against infections. The normal WBC count ranges from 4,500 to 11,000 WBC’s per cubic millimeter of blood. Higher WBC counts (above 30000 cells per cubic millimeter) indicate an infection, systemic illness, inflammation, leukemia, or burn- induced tissue injury. However, manual or visual quantification of parasitemia in the thin blood films and WBCs in leukemia is an extremely tiresome, time-consuming, and subjective task with a high probability of counting error. An accurate segmenting mechanism and counting mechanism that gathers information about the distribution of microscopic particles may help diagnose abnormalities during clinical analysis. WBCs count is very important in the diagnosis of several diseases, hence this paper has acutely worked on the issues of extracting and counting of White Blood Cells in the images captured from the Electronic microscope. The proposed algorithm separates WBCs from other blood cells in the image and counts the total number of WBCs present in the images. The proposed work has been done using OPENCV 2.4.10 library and ANDROID 4.2.2 (Jellybean) platform. Finally the count is obtained in per cubic millimeter (cu mm), which is standard practice of a medical practitioner. II. In [1] provide the very fast, easy and non-expensive segmentation process through thresholding. With the aid of thresholding methods differentiate the grey level in the image from the background level and also the images are do not touch each other, it is one of the significant role of the segmentation by thresholding. segmentation method for white blood cells was implemented in [2], but this also based upon thresholding but that thresholding is depending upon several gray level thresholding. Filters are implemented in this method. Low pass filters are used in this method with window size of 5 x 5. In [3] performed comparisons between nine image segmentation which is gray level thresholding pattern matching, filtering operators, morphological operators, edge detection operators, gradient-in method, RGB color thresholding, color matching andHSL (hue, saturation, lightness) and color thresholding techniques on RBC and concluded that there is no single method can be considered good for RBC segmentation [4].These are two difficult issues in image segmentation where common segmentation algorithms cannot solve this problem [5]. Besides that, there are staining and illumination inconsistencies also acts as uncertainty to the image Sabino and Costa [7] used the Green channel of the RGB model to segment WBC. On the other hand, Westpfalz applied HSI color model to separate WBC from background and de-cluster the clustered WBCYang, Foran and Meer [9] improved the algorithm of IGDS to better segment WBC from other BCs presented in the smear image. Sinha and Ramakrishnan [10] used color used HIS equivalent of the WBC image, K-Means clustering followed by EM- algorithm to segment WBC along with the cytoplasm nucleus. In [11] used fuzzy patch labeling to segment WBC from other blood elements. The main drawback of the above systems is that they have not concentrated on doing segmentation process in the Android Smart phone. Hence those systems cannot be afforded to remote/rural areas. The proposed system has focused on this aspect. The proposed system will run on the Android Smart phone and it has used HSV color model in order to segment the blood smear images collected from the different Blood samples LITERATURE REVIEW One more image @ IJTSRD | Unique Reference Paper ID - IJTSRD20293 | Volume – 3 | Issue – 2 | Jan-Feb 2019 Page: 137
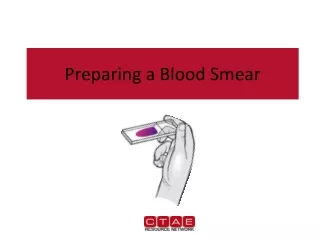
International Journal of Trend in Scientific Research and Development (IJTSRD) @ www.ijtsrd.com eISSN: 2456-6470 III. This paper introduces an automatic WBC count using computer vision which helps to perform the counts accurately using image based analysis from which the blood smear taken by the electronic microscopic. Steps involved in the process of estimating the White Blood Cells include: Image Acquisition, Image Segmentation, Image Post processing and WBC counting. Figure 1 shows the overall flow of the proposed system. METHODOLOGY Figure.3, shows the original blood smearmicroscopic image Preprocessing, Image Figure.3: Original blood smear microscopic image B.Image Pre-Processing The input for this step is a blood smear image and this image is enhanced and filtered to get a good quality image for the next steps. The higher resolution image is decoded using Bitmap decode in order to reduce the resolution of the image. Further the image is converted to HSV image, which clearly defines the bright objects such as WBC. The pre-processed image is sent for Image Segmentation. Figure. 4, shows the HSV image. Figure.1: Flowchart of the proposed system A.Image Acquisition This is the first method which is performed to capture the image from the prepared blood smear image using Electronic microscope. The blood smear slide is prepared in the form of tongue shape, and then the images are captured from the feather edge of the blood smear as shown in Figure2. The images are captured from the slides by an Olympus BX50 microscope equipped with Moti camera. For the proposed method the blood smear images of the two patients are considered, for each patient a single slide is prepared from which ten sample images are captured at different angles. These images are stored in JPEG format. The dataset used in this project consists of actual microscopic images of blood samples, captured in the Laboratories. Figure.4: HSV image. Figure 2: Blood smear in tongue shape C.Image Segmentation The input for this step is the pre-processed image. Here two threshold values have been considered namely lower and upper threshold values. Where the lower threshold value is set to (120,100,100) and the upper threshold value is set to The images were taken by placing the prepared blood smear under the electronic microscope at a magnification factor of 40x. The image thus captured is provided as an input for the preprocessing stage. @ IJTSRD | Unique Reference Paper ID - IJTSRD20293 | Volume – 3 | Issue – 2 | Jan-Feb 2019 Page: 138
International Journal of Trend in Scientific Research and Development (IJTSRD) @ www.ijtsrd.com eISSN: 2456-6470 (179,255,255), in order to segment the image. i.e, these threshold values are applied to extract the saturation component say S, because this S in the image show clearly the White blood cells. Figure 5, shows the segmented image. Figure.7: Extraction of contours Figure.5: Segmented image D.Image Post-Processing After segmentation the noise present in the segmented image will be removed using Gaussian blur method of kernel size 17 x 17. A Contour can be explained simply as a curve joining continuous points, having same color or intensity. The proposed method extracts the contours of the cells in the segmented image and then the area of the each contour will be found. From the experimental results we found that if the contour area lies between 5,400 to 6,000 pixels, then those contours are considered as WBCs contours. For highlighting WBCs area draw contour method is used. In this case, we obtain three different images for each method. Figure 6, shows the image after applying Guassian blur. Figure 7, shows the image after extracting the contours. Figure 8, shows the image after applying Draw contour. Figure.8: After applying draw contour E.Counting After the application of Draw contour method only the WBCs cells will be highlighted, which will be used for counting purposes. However, blood count in medical terms means the number of blood cells in a cubic millimeter of blood volume. Hence we have deduced a formula (1) to calculate the number of white blood cells per cubic millimeter, based on the number of cells in the area of the given image of the blood sample. We have assumed that the thickness of the blood sample film is 0.1 mm, which is the normal medical practice. This allows for an overlapping of maximum two layers in thickness, which is the common trend in the images provided. This formula requires number of white blood cells Figure.6: After applying Guassian Blur @ IJTSRD | Unique Reference Paper ID - IJTSRD20293 | Volume – 3 | Issue – 2 | Jan-Feb 2019 Page: 139
International Journal of Trend in Scientific Research and Development (IJTSRD) @ www.ijtsrd.com eISSN: 2456-6470 obtained from each blood smear image, where the number of blood smear images per patient is considered to be ten. There is a standard value which is suggested by the pathology technician, which is a constant value to be multiplied with the result obtained from dividing the number of White blood cells obtained with the number of input images per patient i.e., ten. The overall result is measured in cubic millimeter (cu mm). Considering these factors the formula for the WBCs count becomes: Segmentation Techniques”, Proceeding of International Conference on Man-Machine Systems 2006, September 15-16 2006, Langkawi, Malaysia. [4] Nor HazlynaHarun , N. R. Mokhtar ,M. Y. Mashor, H. Adilah, R. Adollah, Nazahah Mustafa, N. F. MohdNasir , H. Roseline, ‘Color image enhancement techniques based on partial contrast and contrast stretching for acute leukaemia images’, ICPE-2008. [5] FatemehZamani, Reza Safabakhhsh: “An Unsupervised GVF Snake Approach for White Blood Cell Segmentation Based on Nucleus”, Signal Processing, The 8th International Conference on Volume 2, 2006. (1) Where, N = the actual WBC count per Cu mm. C = WBC count obtained from images. IV. RESULTS AND DISCUSSION Here in this paper we have considered five patient’s blood smear images for our study. Each of these images is pre- processed by the above mentioned techniques. Finally the number of White blood cells was extracted and counted in each of these images bases on the contours area. The results of our study have been discussed in Table – 1. Table1. Comparison of the results between the proposed method and the Manual method Number of Images Taken per patient (in millions) [6] Montseny, P. Sobrevilla, S. Romani (2004): “A Fuzzy Approach to White Blood Cells Segmentation in Color Bone Marrow Images”, IEEE on 25-29 July, 2004, Budapest, Hungry [7] Sabino, D. M. U, L. da F. Costa, E. G. Rizzatti and M. A. Zago, “A texture approach to leukocyte recognition,” Real-Time Imaging, Vol.10, pp. 205–216, Usenet post to http://www.cse.iitd.ernet.in/~csa03027, February 2004. [8] Hengen, H , O. Gabel, A. Hajra, T. Paulus, M. Ross and S. Spoor, “Development of a system for the analysis and classification of blood and bone marrow cell images to support morphological leukemia,”Kaiserslautern,Germany, February 2004. diagnosis of Blood count by proposed method per Cu mm (in millions) Blood count Manually per Cu mm Patient ID [9] Yang, L, P. Meer and D. J. Foran, “Unsupervised Segmentation Based on Robust Estimation and Color Active Contour Models,” IEEE, Usenet post to http://www.caip.rutgers.edu/riul/research/papers/p df/snake.pdf, January 2004. 1 2 3 4 5 10 10 10 10 10 4990 5020 4870 4980 5180 4800 4780 4950 4875 5030 [10]Sinha, N (neelam@ee.iisc.ernet.in) and A. G. Ramakrishnan “Automation of Differential Blood Count,” Bio-Medical Lab, Department of Electrical Engineering, Indian Institute of Science, Bangalore, IEEE, 2003. (ramkiag@ee.iisc.ernet.in), V. This paper presents a methodology to achieve an automated extraction and counting of White blood cells in microscopic images using Contours. This technique is affordable to remote/rural area, independent of specialist to generate patient WBC report. Results indicate that the proposed method for White Blood Cell counting in blood smear images offers a remarkable accuracy of 96.6% by restricting the input images to ten in number per patient. The proposed method is also very cost-effective and can be easily implemented in medical facilities anywhere with minimal investment in infrastructure. It is also very time effective as manual counting is a very tedious job and time consuming. VI. REFERENCES [1] Milan Sonka, VaclawHlavac and Roger Boyle, “Image processing, Analysis and Machine Vision”, Chapman and Hall, London, 1993. CONCLUSION [11]Ongun,G,U.Halici,K. Leblebicioglu and V. Atalay, “Feature Extraction and Classification of Blood Cells for an Automated Differential Blood Count System,” IEEE International Joint Conference on Neural Networks, pp. 2461-2466, 2001. [12]Vinutha H Reddy. “Automatic RBC and WBC counting for telemedicine system”. Volume 2, Issue 1, January 2014. [13]Prof. Samir K. Bandyopadhyay, Sudipta Roy/ International Journal of Engineering Research and Applications (IJERA) “Detection of Sharp Contour of the element of the WBC and Segmentation of two leading elements like Nucleus and Cytoplasm”. [14]P.S.Hiremath,, Parashuram Bannigidad, Sai Geeta “Automated Identification and Classification of White Blood Cells (Leukocytes) in Digital Microscopic Images”. IJCA Special Issue on “Recent Trends in Image Processing and Pattern Recognition” RTIPPR, 2010. [2] Ferdinand Measurement Systems, Object Recognition and Parameter Estimation”, John Wiley&Sons, West Sussex, England, 1995 van der Heijden, “Image Based [15]International Journal of Emerging Technology and Advanced Engineering Website: www.ijetae.com (ISSN 2250-2459, ISO 9001:2008 Certified Journal, Volume 3, Issue 6, June 2013) “White Blood C [3] Khoo Boon How, Alex See Kok Bin, Alex See Kok Bin, Ng TeckSiong, Khoo Kong Soo: “Red Blood Cell Segmentation Utilizing Various Image @ IJTSRD | Unique Reference Paper ID - IJTSRD20293 | Volume – 3 | Issue – 2 | Jan-Feb 2019 Page: 140