Download
1 / 8
80 likes | 214 Views
This document covers key elements of Stream Ecology (NR 280), including course introductions, syllabus details, and course resources on Blackboard. It highlights significant events such as Hurricane Irene and its impact on Winooski River's flow patterns and ecology. Included are laboratory and field trip information, warnings for travelers, and historical peak flow data. Attention is drawn to critical issues related to flooding in Vermont and provides visual documentation of the river conditions post-Hurricane Irene, showcasing various locations along the Winooski River.

E N D
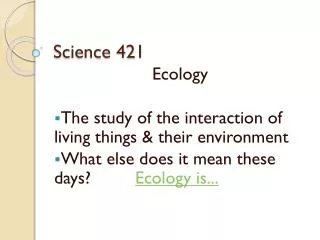
Introductions – Stream Ecology (NR 280) • Welcome! • The Syllabus • Blackboard content • Labs/Field Trips • Hurricane Irene • What next?
Annual Peak Flows from 1927 Peak flow 08/29/2011 16:15 EDT 38,900 cfs Peak flow for Winooski River at Montpelier 08/28/2011 22:30 EDT 14,600 cfs
Effects of Hurricane Irene NBC story on flooding in Vemont http://www.msnbc.msn.com/id/44305129/ns/weather/#.Tlxe1qiy794 Videos from 29 August 2011 (~12-18h after peak rainfall from Hurricane Irene but only a few hours before peak discharge. Images for Winooski River tour, mid-day 29 August 2011 Flow over IBM dam Flow below Rt 15 bridge east of Essex Junction Flow at Cascades in Winooski Flow at Winooski River mouth – scan from bank to bank Eddy at Winooski River mouth – true left bank Floating tree at Winooski River mouth
Introductions – Stream Ecology (NR 280) • Welcome! • The Syllabus • Blackboard content • Labs/Field Trips • Hurricane Irene • What next?