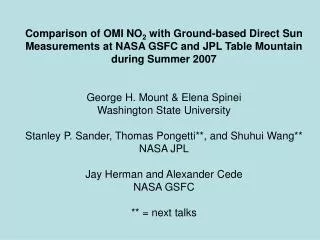
Comparison of OMI NO2 Measurements with Ground-based Observations at NASA GSFC and JPL
This study examines the comparison between Ozone Monitoring Instrument (OMI) NO2 measurements and ground-based direct sun observations collected during summer 2007 at NASA's Goddard Space Flight Center (GSFC) and Jet Propulsion Laboratory (JPL) Table Mountain Facility (TMF). Using multiple instruments such as WSU's MultiFunction DOAS and NASA's PANDORA and UVFTS, we evaluated the consistency of NO2 vertical column densities. Results highlight excellent agreement between ground-based measurements, although spatial inhomogeneities and other factors posed challenges for comparisons with OMI data.

Comparison of OMI NO2 Measurements with Ground-based Observations at NASA GSFC and JPL
E N D
Presentation Transcript
Comparison of OMI NO2 with Ground-based Direct Sun Measurements at NASA GSFC and JPL Table Mountainduring Summer 2007George H. Mount & Elena Spinei Washington State UniversityStanley P. Sander, Thomas Pongetti**, and Shuhui Wang**NASA JPLJay Herman and Alexander CedeNASA GSFC** = next talks
Participating Instruments WSU MultiFunction DOAS (MFDOAS) - basic measurement: slant column • observes direct sun or scattered skylight (DS + MAXDOAS) • spectral coverage: 281 - 498 nm • CCD - 13.5 µm pixel size • spectral resolution 0.83 nm • spectral sampling on FWHM 7.8 pixels • DS uses an integrating sphere • integration time: sub-second GSFC PANDORA - basic measurement: slant column • observes direct sun • spectral coverage: 265 - 500 nm • CCD - 25 µm pixels • spectral resolution 0.4 nm • spectral sampling on FWHM 2 pixels • integration time: sub-second time averaged to 20-sec JPL UVFTS - basic measurement absolute slant column • observes direct sun • spectral regions used for analysis: 488 - 498 nm • spectral resolution: 0.001 nm • integration time: 17 min - observes opposite limbs of sun
data analysis MFDOAS and PANDORA • reduce raw data to slant column using a common reference spectrum from a particular date/time • nonlinear least squares using common cross section (Harder et al., 1997) --> difference between absolute slant column at time of measurement and the absolute slant column in the reference spectrum • determine absolute slant column in the reference spectrum using Langley method, bootstrap method, UVFTS - all are consistent at TMF where clean skies were observed part of the time • correction: 0.13 + 0.01 DU at TMF, 0.25 + 0.01 DU at GSFC for the reference spectra used at each location • apply AMF from direct sun (simple geometry), remove data with SZA > 80° to avoid problems with layer height in AMF calculation UVFTS • Tom Pongetti and Shuhui Wang will talk about the FTS data analysis technique in the next talks
Campaigns Goddard Space Flight Center • data every day 14 - 25 May 2007 • PANDORA - direct sun on ~ 20 sec centers • MFDOAS • direct sun on ~ 1 sec centers • direct sun + scattered sky at 4 azimuths and 4 elev angles ~ 20 min • about half the days were devoted to scattered sky + DS measurements JPL Table Mountain • data every day from 2 July - 12 July 2007 • PANDORA and MFDOAS as above • UVFTS - 17 min cycles on each of the two solar limbs Only direct sun observations are presented here OMI data is collection 3
DS-DOAS vs UVFTS measurements at TMF ground = 0.93 * UVFTS
OMI vs. Ground Based Total NO2 Vertical Column at GSFC fitted slope: ~ 1.2 OMI = 1.2 x ground
Temporal Variability of Total NO2 Vertical Columns (GSFC: 14-May-07)
__ 10a 10 km 2z 6 11z 4 12b 3b 9 10b 7 12a 8 3a JPL TMF region - numbers are dates in July of the OMI observations and are placed at the pixel center; “z” = OMI zoom mode, “a” and “b” indicate overpasses on the same day
OMI vs. Ground Based Total NO2 Vertical Column at JPL-TMF (July 2007)
Conclusions • successful campaigns were carried out in summer 2007 at GSFC and JPL TMF with 3 instrument groups measuring NO2 • excellent agreement between instruments was found, even on time scales of minutes • UVFTS was extremely valuable --> absolute column & confirmation of calibration for the reference column of NO2 for PANDORA and MFDOAS • need a large number of days to get a solid comparison with OMI • comparisons with OMI total NO2 were difficult due to: • spatial inhomogeneities • especially true at TMF - the high elevation and proximity to LA (Tom’s talk next) • times when agreement with OMI should have been good and was not • wave structure at GSFC showed changes on order 10% in minutes above the site • vertical inhomogeneities • movement of polluted air “under” the observing site and inside an OMI pixel • OMI NO2 vertical columns are ~ 15% low at GSFC & poor correlation at TMF • use of scattered sky data is valuable (e.g. MFDOAS at PNNL in Washington), but requires a much more difficult interpretation due to calculation of AMF, vertical structure of NO2, aerosol loading, and spatial inhomogeneities - we are working with PK on use of a combination of near simultaneous DS and scattered sky measurements to improve the analysis
Future • MFDOAS • detailed reduction of campaign scattered sky data • determinations of ozone and formaldehyde • campaigns which will be used for OMI comparison (DS+scatt sky): • WSU fall/winter 2007/2008 • PNNL Richland, WA - spring 2008 • wildfire measurements late summer 2008 • Boise, Idaho December 2008 • Houston, Texas April-May 2009 • US SE for formaldehyde validation • Spain(?) international campaign - summer 2009 or 2010 • PANDORA • deployment of PAN-3 for sun, sky, moon • improved tracking and s/n • build network of 15 instruments to map OMI sub-pixel variation and regional variation • UVFTS - Tom and Shuhui in next talks