Download
1 / 36
360 likes | 487 Views
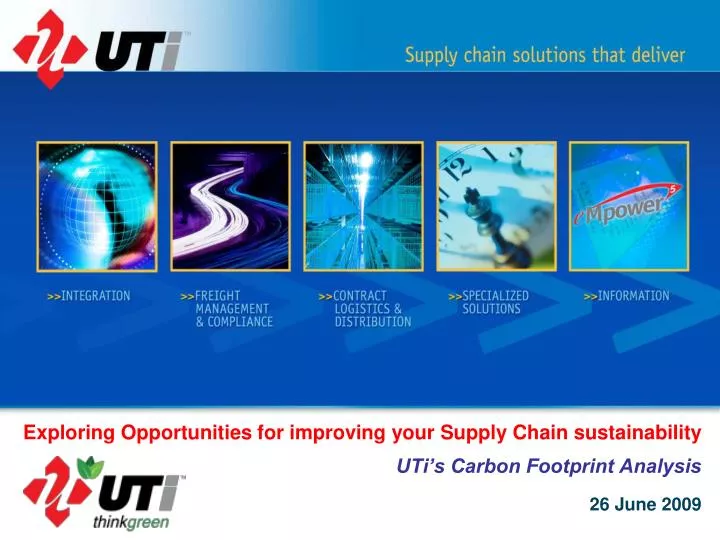
Exploring Opportunities for improving your Supply Chain sustainability UTi’s Carbon Footprint Analysis. 26 June 2009. Executive summary.

E N D
Exploring Opportunities for improving your Supply Chain sustainabilityUTi’s Carbon Footprint Analysis 26 June 2009
Executive summary • Global Warming is resulting from increased concentration of GHG in the atmosphere ; GHG emissions arise mainly from human activity, have dramatic consequences so Public and Private sectors are now launching an increasing number of initiatives to reduce our environmental impact • Transportation/Logistics sector represents a substantial share of the total GHG emission • In line with the UTi global environmental strategy, thinkgreen, UTi has developed the Carbon Footprint Analysis to support our Clients with analyzing the environmental impact of their logistic activities • This analysis supports • to decrease the environmental impact • to gain recognition from our client’s clients • to report out according to regulations • to participate in carbon markets Carbon Footprint Analysis
Executive summary (continued) • The proven approach consists in 6 steps and the emission calculations are supported by the UTi Ecotool, developed by UTi for that purpose and following the standards from the GHG Protocol • The first results of the application of this methodology are very encouraging : we could for instance help a major car manufacturer to determine the emissions resulting from its logistic activities from America to Europe • UTi can bring added value to the Client by combining its competences and expertise in logistics with its knowledge and strong interest in environmental matters • UTi sees this joint project as a win-win situation (helping our client to become greener while allowing UTi to be greener) that will deepen further the partnership between the Client and UTi Step 3 Model Configuration Step 6 Next Steps Step 2 Data Collection Step 1 Getting started Step 4 Analysis Step 5 Reporting Carbon Footprint Analysis
Agenda • Introduction • UTi Think Green Strategy • What is the Carbon Footprint Analysis? • The UTi Ecotool • Case Studies • Contact details Carbon Footprint Analysis
Realizing the human negative impact on the environment... • Global warming is a fact and the principal cause for it is human activity: industrialisation has increased the amount of Greenhouse Gases in the atmosphere, trapping the sun energy in the atmosphere and heating up the earth • The effects of Global Warming (rising sea level, extinctions, precipitation patterns changing, extreme weather events, etc.) have dramatic consequences for the future • Now that the problem is acknowledged, action needs to be taken Global warming is a "modern" problem - complicated, involving the entire world, tangled up with difficult issues such as poverty, economic development and population growth. Dealing with it will not be easy. Ignoring it will be worse. “Feeling the heat”, UNFCCC publication Carbon Footprint Analysis
... Public and Private sectors are now taking action Response from the governments • The world's primary international agreement on reducing greenhouse gas emissions is the Kyoto Protocol, negotiated in 1997, now ratified by more than 180 countries, committed to specific targets for emissions of GHG gases by 2012 • Many countries are taking steps to reduce emissions through national policies including: • Introduction of emissions trading programs (carbon markets) allowing companies to sell or purchase carbon credits, depending on their allowances, e.g. the EU Emission Trading Scheme (ETS) • Voluntary programs • Carbon/Energy taxes, etc. • Some specific industrial sectors are already subject to regulations and included in the Emission Trading Programs; more industries will follow in the near future • In a post-Kyoto situation, companies most likely need to: • Annually report on their GHG emissions (their carbon footprint) • Buy/Sell their additional or surplus emission CAP on the carbon trade market • Firms must understand and manage their GHG risks to ensure long-term success in a competitive business environment, and to be prepared for future climate policies Implications for the corporate world Carbon Footprint Analysis
... Public and Private sectors are now taking action (continued) 2005 2008 2010 2010 2010 2010 2050 2013 Carbon Footprint Analysis
UTi recognizes the environmental challenge for companies and has developed the Carbon Footprint Analysis to support them • Several firms have led the way and are already inventorying their GHG emissions and taking proactive actions to reduce their environmental impact Annual Greenhouse Gas Emissions by Sector • Transport sector causes 13.1% of the total GHG emissions; thus, a company’s logistic activities often represent a major part of its carbon footprint • As most of the companies are outsourcing their logistic activities, they lack the information and the visibility to perform a proper carbon inventory of their logistics activities Waste and waste water 2.8% • UTi has developed the Carbon Footprint Analysis to support our clients with this issue • The analysis will allow to: • Calculate the GHG emissions occurred during all their logistic activities, not only transportation but also warehousing and handling activities • Identify improvement opportunities to reduce their logistic carbon footprint Source: IPCC Synthesis Report - 2007 Carbon Footprint Analysis
Value to the Client through the impact of reducing CO2 emissions Quantified Value • Visibility of carbon emissions and its impact reveals that reducing costs and reducing greenhouse gas emissions are not necessarily mutually exclusive initiatives • Optimization and management of CO2 emissions can bring to the companies competitive advantage and cost reduction opportunities • Optimization against CO2 in most of the cases results in simultaneous network optimization against cost, e.g.: • Currently some companies are addressing sustainability head-on and report their carbon emissions. Most likely in the nearest future companies will be forced to become environmentally responsible by standard law regulations • Reducing total carbon footprint within supply chain now will prevent from paying additional, soon mandatory fees and can bring for those ahead a return on investment with extra carbon credits • Route optimization against CO2 • Milk runs, less km driven, truck idle time reduction • Cost reduction • Transport mode optimization against CO2 • Intermodal transport introduction Carbon Footprint Analysis
Understanding of carbon foot printing • Carbon foot printing focuses on global warming and climate change and calculates the amount of Greenhouse Gases (GHG) emitted, all converted in carbon dioxide equivalents (CO2e) • Considering logistic activities, the major Greenhouse Gases emitted are CO2, S2O and CH4 Therefore, our study will only focus on these gases CO2 HFCs S2O GHG Concentration PFCs Variation in the Orbit Around the Sun SF6 Global Warming CH4 Volcanic Eruptions Water Pollution Change in Solar Luminosity Environmental Impact Noise … Air Pollution Carbon Footprint Analysis
Agenda • Introduction • UTi Think Green Strategy • What is the Carbon Footprint Analysis? • The UTi Ecotool • Case Studies • Contact details Carbon Footprint Analysis
The Carbon Footprint Analysis comes within the scope of UTi environmental strategy The UTi Think Green strategy aims not only at UTi becoming greener but also at supporting UTi Clients to become greener Carbon Footprint Analysis
The Carbon Footprint Analysis comes within the scope of UTi environmental strategy (continued) Consulting Internal Ocean/Air Freight Internal IT CL Facilities Trucking Carbon Footprint Analysis
Agenda • Introduction • UTi Think Green Strategy • What is the Carbon Footprint Analysis? • The UTi Ecotool • Case Studies • Contact details Carbon Footprint Analysis
Goal and Objectives Goal • Jointly perform a study of the carbon footprint of the client’s logistics • Explore the areas of opportunity for reduction of the client’s logistic emissions • Identify ways that UTi can add value for the client in materializing these opportunities • The Carbon Footprint Analysis can serve several business goals for the client: • Public reporting and participation in voluntary programs • Participation in mandatory reporting programs • Participation in emissions trading markets • Recognition from customers • Gain an understanding of the client’s logistics and its different emission sources • Measure the current quantities of carbon emissions generated by the client’s logistics activities • Identify opportunities for reduction of carbon emissions • Prioritize opportunities and agree on next steps and/or projects to improve the client’s logistic carbon footprint Objectives Carbon Footprint Analysis
Scope of the study • UTi can help the client: • To calculate its current carbon footprint for its logistics activities (used as baseline) • To optimize its footprint by reducing supply chain emissions based on overall ROI • To manage the client’s emissions on a continuous basis, pro-actively building flexibility and agility into the supply chain Packaging Extracting/Manufacturing Raw material Product Usage Product Disposal Nature Suppliers Warehouse Manufacturing Store Transportation “Up to 75 % of a company's carbon footprint is coming from transportation and logistics.” Green Transportation & Logistics Report Eyefortransport - July 2008 Our scope Carbon Footprint Analysis
Project Approach The Carbon Footprint Analysis consists of six Steps, presented below: Step 1: Getting started Step 6: Next steps Step 2: Data collection Steps 1 to 5 Step 6 Step 5: Reporting Step 3: Configuration of the UTi Ecotool Step 4: Analysis Carbon Footprint Analysis
Project Planning Step 3 UTi Ecotool Configuration Step 6 Next Steps Step 2 Data Collection Step 1 Getting started Step 4 Analysis Step 5 Reporting 1 week 2-4 weeks 1-2 weeks 2 weeks 2 weeks 1 week • Formation of team • Kick-off • Discussion on objectives, scope and level of details • Final agreement on project scope, activities, deliverables, project organisation and timeline 1 2 • Collection of data • Validation of data • Adaptation of the model • Validation of the assumptions 3 Step • Calculation • Sensitivity analysis – comparison of influence from different factors • Scenario analysis 4 • Writing of the report • Reference of all sources used for information, emission factors 5 • Closing • Migration Plan 6 Carbon Footprint Analysis
Step 1 – Getting Started (continued) Level of detail The definition of the scope is essential to the project Key Components of Carbon Footprint Scope Geography Which geographies should be included? Direct/Indirect Emissions Which emission sources should be included? Supply Chain Which supply chain segments and distribution lanes should be included? Product Which business divisions, product segments, and/or SKUs should be included? Activities Which activities (transportation, warehousing, handling, etc.) should be included? The agreement on the level of detail is another essential element to get started Availability of data Accuracy Carbon Footprint Analysis
Agenda • Introduction • UTi Think Green Strategy • What is the Carbon Footprint Analysis? • The UTi Ecotool • Case Studies • Contact details Carbon Footprint Analysis
The UTi Ecotool • The tool is comprehensive, yet basic in setup, easy to use and adaptable • Real historical tracking data is used as part of the input: • Standard reports from UTi’s visibility suite are used for existing clients • Any other data source might be used for others • The results allow for detailed analysis: • Per activity • Per geographical area • Per supplier • Per mode • Per lane • …. UTi Ecotool front page Carbon Footprint Analysis
Calculations are based on the standards defined by the GHG Protocol, the most widely supported method The GHG Protocol is the most widely used international accounting tool for government and business leaders to understand, quantify, and manage greenhouse gas emissions. The GHG Protocol is working with businesses, governments, and environmental groups around the world to build a new generation of credible and effective programs for tackling climate change • Most of the world’s largest corporations follow GHG Protocol standards including: AstraZeneca, BP, Caterpillar, Daimler, DuPont, FedEx, Ford, General Electric, General Motors, IBM, Ikea, International Paper, Philips, Royal Dutch Shell, Sony, Unilever, UPS, Volkswagen and many more Carbon Footprint Analysis
Agenda • Introduction • UTi Think Green Strategy • What is the Carbon Footprint Analysis? • The UTi Ecotool • Case Studies • Contact details Carbon Footprint Analysis
Case study 1: UTi calculated carbon emissions for transatlantic freight shipments Introduction • A Car Manufacturer asked UTi to determine the Carbon Footprint of its logistic activities Challenge • A global automotive industry leader approached UTi with a request for support in identifying & calculating the carbon emissions within their supply chain • Solution • In order to gain visibility of the carbon emissions in Client’s supply chain, UTi decided to develop and use its own methodology and Ecotool (Carbon Footprinting tool based on a combination of the best aspects from existing carbon calculators) • UTi focused on the effects from transportation, warehousing and handling and as input we used real historical data from standard reports of UTi’s visibility suite ( ). Detailed analysis allowed to calculate the carbon emissions per activity, geographical area, supplier, mode, etc. Carbon Footprint Analysis
Case study 1: UTi calculated carbon emissions for transatlantic freight shipments (continued) • The UTi carbon footprint project complements existing green initiatives throughout the Client’s product life cycle Auto OEM - UTi project Raw material Suppliers Warehouse Factory Dealers Usage s Scrapping Nature Fuel - Efficient Vehicles OEM’s Eco Efficient Vision Pays Off Greener Miles OEM Q1 suppliers are ISO 14001 certified. Eco - driving: ten easy Cleaner tips for saving fuel Manufacturing Carbon Footprint Analysis
Case study 1: CO2 emissions for one specific ocean lane From train station to departure port From departure Port to arrival Port From arrival Port to Inland Port From CC to train station From Inland Port to DC From DC to Plant From Supplier to CC Barge 346km Train 923km Ship 6102km Truck 1447km Truck 30.4km Truck 6.8km Truck 7.3km7.4km $ 230,971,770 55.4kg 183.1kg 160.2kg 3.4kg 36.4kg 2.8kg 2.8kg Transportation Dry Port Dry Port Dry Port Maritime Port Maritime Port Dry Port Dry Port 673g 673g 673g 673g 673g 673g 673g Handling CC - 7 days Dep. Port- 3 days DC – 1 day 0g 776.1g 0g 5432.4g 2328.2g 0g 0g Warehousing Client’s plant Supplier % of total CO2 emissions in scope 4.2kg 3.5kg 56.1kg 186.1kg 37.1kg 161.0 kg 4.61kg Column Total 0.8% 0.9% 12.4% 41.1% 8.2% 35.6% 1% % 221.7kg 407.8kg 444.9kg 448.4kg 452.6kg 1335.6kg 165.6kg Cumul Total Carbon Footprint Analysis
Case study 1: CO2 emissions for the same lane, using airfreight From CC to departure airport From arrival airport to Plant From departure airport to arrival airport From Supplier to CC Truck 425km Airplane 6649km Transportation Truck 6.5km Truck 187km 161kg 11392.6kg 2.4kg 80.5kg Dry Port Dry Port Dry Port Dry Port Handling 673g 673g 673g 673g Airport - days CC - 7 days Airport - ? days Warehousing 0g 5432.4g 780g 780g Client’s plant Supplier % of total CO2 emissions in scope 81.2kg Column Total 161.7kg 8.9kg 11392.3kg % 1.39% 0.08% 97.8% 0.7% Cumul Total 161.7kg 170.6kg 11562.9kg 11644.1kg Carbon Footprint Analysis
Case study 1: Comparison of emissions • Comparison between Ocean Freight and Air Freight Carbon Footprint Analysis
Case study 1: An idea of the potential monetary value of these emissions Carbon Footprint Analysis
Case study 2: UTi can calculate the carbon footprint for each shipment on a regular basis or on a spot-basis Introduction • A leading Pharmaceutical Client wants to determine the Carbon Footprint per shipment on a spot-basis Challenge • The Client asked UTi to provide the carbon footprint for their shipments occurred last year via a tender • Solution • Use the Ecotool to calculate the GHG emissions of each shipment, after adapting it to the specific case of this client • Emissions from door to port • Only transportation considered • Airfreight and ocean freight included • FCL and LCL • Document the assumptions used as basis for the calculations Introduction • A current Client in the garment sector wants to add the Carbon Footprint of its shipment to the existing monthly KPI report Challenge • The Client asked UTi to provide the carbon footprint for their shipments on a monthly basis, adding it as a new KPI in our monthly report • Solution • Use the Ecotool to calculate the GHG emissions of each shipment, after adapting it to the specific case of this client • Emissions from door to door • Only transportation considered • Airfreight and ocean freight included • Only FCL • Document the assumptions used as basis for the calculations Carbon Footprint Analysis
Agenda • Introduction • UTi Think Green Strategy • What is the Carbon Footprint Analysis? • The UTi Ecotool • Case Study • Contact details Carbon Footprint Analysis
Contact SDi to discuss how we can help you greening your Supply Chain UTi Supply Chain Design & Innovation Capronilaan 12 1119 NR Schiphol-Rijk The Netherlands +31 (0)20 655 1666 Carbon Footprint Analysis
Why UTi? (Background information) • UTi combines the knowledge and expertise in logistics with the knowledge and strong interest in environmental matters • In that purpose, UTi invested in developing the UTi Ecotool and a framework around it to manage efficiently a carbon footprint analysis • UTi benefits from direct access to the Client operational data via eMpower and other systems • UTi sees this approach as a win-win situation: • Helping our client to understand their current emissions in their logistic activities and to reduce this environmental impact • Reducing our own environmental impact by offering a greener logistic service to our interested clients • This joint project will foster the partnership between the Client and UTi Carbon Footprint Analysis
AppendixThe UTi Ecotool – screenshot 1 Selection of the shipment UTi Ecotool visual summary per shipment Detail of the emissions for the chosen shipment Carbon Footprint Analysis
AppendixThe UTi Ecotool – screenshot 2 Selection of the lane UTi Ecotool visual summary per lane Detail of the emissions for the chosen lane Carbon Footprint Analysis
AppendixThe UTi Ecotool – screenshot 3 UTi Ecotool analysis sheet Carbon Footprint Analysis