Download
1 / 24
250 likes | 548 Views
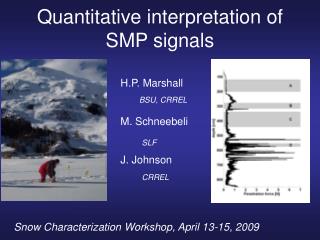
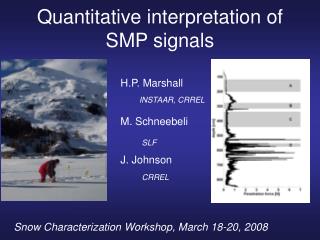
Quantitative analysis of process NMR signals in the time domain. Alison Nordon , 1 Colin A. McGill, 1 Paul J. Gemperline 2 and David Littlejohn 1. 1 Department of Pure & Applied Chemistry/CPACT, University of Strathclyde, Glasgow, UK

E N D
Quantitative analysis of process NMR signals in the time domain Alison Nordon,1 Colin A. McGill,1 Paul J. Gemperline2 and David Littlejohn1 1 Department of Pure & Applied Chemistry/CPACT, University of Strathclyde, Glasgow, UK 2 Department of Chemistry/MCEC, East Carolina University, Greenville, NC, USA
Process NMR • Low-resolution NMR has been used to determine moisture and fat content • However, chemical shift information is required to obtain chemical composition • High-field NMR spectrometer not suited to the process environment • Use low-field NMR spectrometer employing a permanent magnet which provides medium resolution
NMR spectrometer • Resonance Instruments MARAN Ultra • 1H, 19F, 31P • Permanent magnet (29 MHz for 1H) • Small, robust instrument (53 x 50 x 30 cm3) • Suitable for on-line and at-line measurements • Additional features: • shim coils • lock channel
Electronics Power supply Magnet Sample Resonance Instruments MARAN Ultra spectrometer
1H NMR spectrum of a sample from a benzene production process
Quantitative analysis • Overlapping signals • multivariate, e.g. PLS, analysis of spectra • Construction of calibration model • reference technique • simulate samples • Validation and testing of model • Model maintenance and update
FT n FID (time domain) spectrum - unphased (frequency domain) spectrum - phased (frequency domain) Processing of NMR signals
1 n A 1 A FT T2 t T2 n frequency domain (spectrum) time domain (FID) Data analysis - Analysis of FIDs
Analysis of FIDs • Eliminate data processing steps that are difficult to automate, e.g. phasing • Potential for model-free analysis • Methods investigated: • continuous wavelet transform (CWT) • modification of generalised rank annihilation method (FID-GRAM) • modification of direct exponential curve resolution algorithm (FID-DECRA)
exponential decay character of FID data set 1 data set 2 + FID-DECRA • Construction of Hankel matrix, H, from FID • Create 2 sub matrices, H1 and H2, from H • Obtain individual components from solution to generalised eigenproblem • Calculate amplitude, area and T2 for resolved signals
magnitude spectrum of resolved components FID-DECRA 40 20 0 -20 -40 n1 = 10 Hz, n2 = 12 Hz n/Hz Example
Applications of FID-DECRA • Quality control • determination of ethoxy chain length in nonyl phenol ethoxylates (1H NMR) • Reaction monitoring • dehydroxylation of tetrafluorohydroquinone (19F NMR)
Determination of ethoxy chain length in nonyl phenol ethoxylates
Conclusions - nonyl phenol ethoxylates • Results obtained using FID-DECRA comparable to those obtained from univariate analysis of spectral data • However, with FID-DECRA the FID is analysed directly and no phase correction is required could be automated
product by-product Dehydroxylation of tetrafluorohydroquinone
TFHQ TFB TFP TFP 19F NMR spectrum of mixture(with 10 Hz line broadening)
TFHQ TFB TFP TFP Magnitude spectrum of FID-DECRA resolved components
FID-DECRA - 1 calibration sample (PLS - 10 calibration samples) FID-DECRA v PLS
Conclusions - fluorocarbons • Possible to analyse quantitatively 19F NMR FIDs using FID-DECRA with a single calibration sample • Accuracy and precision of FID analysis using FID-DECRA (1 calibration sample) comparable to that of spectral analysis using PLS (10 calibration samples)
Overall conclusions • Quantitative results can be obtained from a single FID using FID-DECRA • No phase correction needed • Insensitive to solvent effects • FID-DECRA analysis could be automated useful in process NMR spectrometry
Acknowledgements • Resonance Instruments • ICI