Download
1 / 9
90 likes | 159 Views
Investigating impact of El Nino on large swell events at Goleta Coast during winter months. Analysis based on buoy data showing possible increase in wave frequency and magnitude. Suggestions for future research directions.

E N D
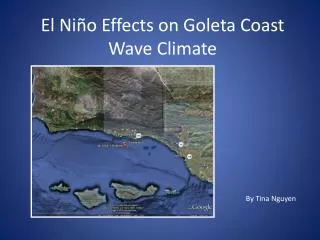
El Niño Effects on Goleta Coast Wave Climate By Tina Nguyen
Summary • Research question: How does El Nino affect frequency and magnitude of large swell events on Goleta coast during December, January, February • Preliminary work – investigate relationship between large swell events and El Nino • Following previous study of Seymour et al 1984 • Data did not support Seymour’s correlation of large swells with Oceanic Nino Index (ONI) • Seymour used data from Harvest buoy • This study used Goleta Point buoy • Study did showed annual increase of frequency of waves during January – possible change in EN or wave climate
Methodology • El Nino can increase large swell events in two ways: • 1. number of storms remains constant but magnitude of each storm increases = overall increase of large swell events (over 2m). • 2. magnitude of storms remains constant but frequency of storms increase = increased probability of large swell events given the same distribution of swell heights.
Methodology cont’d • Downloaded Goleta buoy data from Coastal Data Information Project (CDIP) • Histogram of daily max wave heights (Hs) showed 74% of measurements below 2 m • Defined large swell event as over 2 m threshold • Summarized number of days over 2 m to measure frequency of large swell events • Graphed frequency against sea surface temperature anomalies (SST) from ONI to investigate correlation
Results • No consistent pattern between anomalous sea surface temperature and frequency of high waves was evident • The 2009/2010 El Nino showed a correlation with increased magnitude and frequency of waves • The 2005-2008 period does not show any consistent relationship • Recognized increasing pattern in frequency of maximum wave heights during the month of January
Discussion and Future Directions The Goleta buoy is affected by wave shadowing from Channel Islands and Point Conception, possibly obscuring El Nino effects • Further research should use Harvest Platform buoy data since it is more exposed to all North Pacific storm activity • longer time series including strong El Nino events (1982-83 or 1997-98) is necessary to understand decadal impacts of El Nino • Data from multiple buoys is needed – one location is not representative of entire region • Parameters such as wave period and swell direction should also be analyzed • The annual increase during January presents an opportunity to assess possible climate change effects