Download
1 / 66
3.14k likes | 8.3k Views
Basics of Flow Cytometry. Prashant Tembhare. Flow Cytometry is the automated measurement of Physical, Chemical and Biological properties of individual cells (Cytometry) or particles flowing in a single stream (Flow) in a fluidic system. What is Flow Cytometry?. Cyto = cells.

E N D
Basics of Flow Cytometry Prashant Tembhare
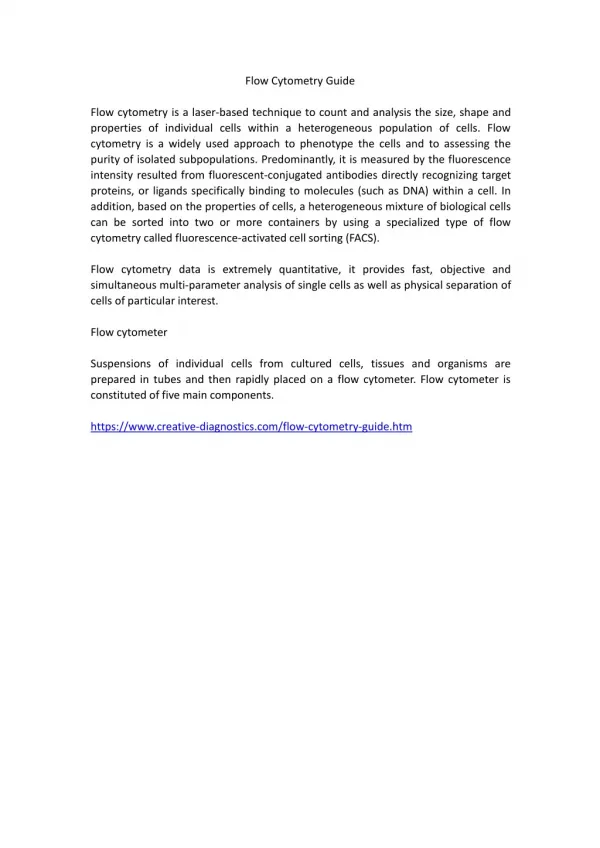
Flow Cytometry is the automated measurement of Physical, Chemical and Biological properties of individual cells (Cytometry) or particles flowing in a single stream (Flow) in a fluidic system. What is Flow Cytometry? Cyto = cells Metry = measurement Flow = in a flow or a stream
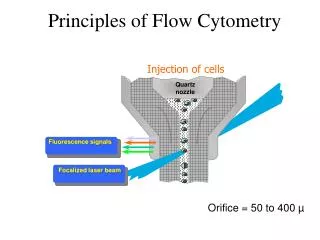
Flow cytometry • Flow cytometer is an instrument that - illuminates cells as they flow in front of a light source & - detects and correlates the signals from the illumination. • Unique Ability – rapid analysis of thousands of cells cells flow at a velocity of 5–50 m/s Analyze 500-5000 cells/second - simultaneous illustration of multiple antigens • Two major principles 1. Measurement of physical properties 2. Measurement of antigenic properties
Principles of flow cytometry 1. Measurement of physical properties i.e. size and complexity (granularity). Right Angle Light Detector Forward Light Detector c LASER BEAM
2. Measurement of ANTIGENIC properties of cell surface and inside the cell with the help of antibodies labeled with different fluorochromes. Principles of flow cytometry c LASER BEAM
Instrument Components Fluidics:Specimen, Sheath fluid, flow chamber. Optics: Light source(s), mirrors, filters, detectors, spectral separation Electronics:Controls pulse collection, pulse analysis, triggering, time delay, data display, gating, sort control, light and detector control Data Analysis: SOFTWARE- Data display & analysis, multivariate/simultaneous solutions, identification of sort populations, quantitation
Crosland-Taylor - Hydrodynamic focussing= coaxial flow → a narrow stream of cells flowing in a core within a wider sheath stream Provides a highly controlled fluid stream. Provides exact location of a cell in three dimensions Maintains sample handling compartment (Flow Cell) Forced under pressure through a conical nozzle assembly geometrically designed to produce a laminar flow This fluid is SHEATH FLUID - Isotonic fluid Fluidics
Fluidics ↓D by 10-40 = ↑V by 100-1600 fold
LASER (argon) Dichroic Filters and Mirrors (b) Photodiode (d) PMT (photo multiplier tubes ) OPTICS
What is Fluorescence ? O HO = 488 nm = 520 nm C IncidentLight Energy CO2H Emitted Fluorescent Light Energy FluoresceinMolecule Antibody • The fluorochrome absorbs energy from the laser. • The fluorochrome releases the absorbed energy by: • vibration and heat dissipation. • emission of photons of a longer wavelength.
Fluorescence Emitted fluorescence intensity is proportional to binding sites FITC FITC FITC FITC FITC FITC FITC FITC Number of Events FITC FITC 0 Log scale of Fluorescent Intensity
Emission Spectra 100% FITC APC PE PerCP Normalized Intensity 0% 600 400 500 700 800 Wavelength (nm)
Emission Spectra 100% Alexa 430 PI FITC APC PE-Cy7 PE PerCP PerCP-Cy5.5 Cascade Blue Normalized Intensity 0% 600 400 500 700 800 Wavelength (nm)
Fluorescent Light absorption Control Absorption No blue/green light red filter
Dichroic Filters Detector 1 Detector 2 Dichroic Filter • Can be a long pass or short pass filter or band pass • Filter is placed at a 45º angle to the incident light • Part of the light is reflected at 90º to the incident light, and part of the light is transmitted and continues on.
Coulter optical system - Elite PMT2 PMT1 PMT4 PMT3 555 - 595 575 BP 525 BP 488 BP PMT5 L L L D D D 632 BP 488 BK 675 BP 0 5 5 9 2 5 4 6 0 655 - 695 APC PMT6 TM PMT7 The Elite optical system uses 5 side window PMTs and a number of filter slots into which any filter can be inserted
Optical Design PMT 5 PMT 4 Sample PMT 3 Dichroic Filters Flow cell PMT 2 Scatter PMT 1 Laser Sensor Bandpass Filters
Electronics • Compute pulse height • Perform calculations for pulse area and pulse width • Calculate ratios • Convert analog signals to proportional digital signals • Interface with the computer for data transfer
Electronics:Triggering on a voltage pulse Laser Voltage Time Voltage Laser Time Voltage Laser Time
Optical to Digital PMT Voltage Signal Out Log amplification of signals Analog to Digital Converter 2 Options for SSC and fluorescence channels PhotonIn Linear amplification of signals Voltage In PMTPower Supply compensationcircuit Levels 0–1000V adjusted by slider control on computer Gain levels from 0–9.99 adjusted by slider control on computer Amplifier output voltage ranging between 10mV to 10V
Data Analysis by Software Display Plots Create Gates Display Statistics Analyze Statistics Plot Types:Gate Types:Statistics Types: Results: Histogram Polygon # of Events % positive for Dot Ellipse % of Gated particular markers: Contour Histogram % of Total -viable cells Density Quadrant -immunophenotype meanmean fluorescence intensity geometric mean DNA content standard deviation absolute counts
Sample processing • Single cell suspension:all specimens with cells in suspension PB, BMA, CSF, PF, BAL Solid tissue • Fine needle aspirations • Tissue suspensions - slicing, mincing and teasing = Filtering • Sample stabilization:Anticoagulant - EDTA or Heparin – Transport at RT • Enrichment of cells:For leucocytes - RBC Lysis - NH4CL or - Density gradient centrifugation – Ficoll medium • Antibody staining:Separate cells-wash-incubate with Ab-F in dark • Acquisition: Acquire the stained cells at earliest or Fixed and store in refrigerator • Data Analysis: VIMP – Needs experience and knowledge
Clinical Applications of Flow Cytometry Enumeration of lymphocyte subsets (CD4/CD8) Immunophenotyping of hematologic malignancies Minimal Residual Disease (MRD) Myelodysplatic Syndrome (MDS) HLA B27 typing PNH diagnosis (CD55-/CD59-) DNA/RNA analysis & Cell cycle studies Reticulocyte analysis Hemotopoietic stem cell (CD34+)analysis Platelet analysis Antigen quantitation e.g. CD20, CD22, CD33 etc Other uncommon Microbiology Determination of drug resistance to chemotherapy Cell Function analysis
FCM in management of Acute Leukemia • Accurate diagnosis and classification • Knowledge of prognostic factors • Monitoring response • Diagnosis of early relapse at other sites like CNS
ALL naïve germinal center B-lymphocytes Plasma cells Lymphoid progenitor T-lymphocytes Neutrophils AML Myeloid progenitor Eosinophils Hematopoietic stem cell Basophils Monocytes Platelets Red cells AUL Mixed Lineage Leukemia
FCM in diagnosis and classification • Identification of blasts • Enumeration of blasts • Assignment of blast lineage • Identification of abnormal blasts • Subclassification
Identification of blasts • Low side light scatter • Weak CD45 expression • Markers of immaturity such as CD34 and TdT • Lack markers of maturation Myeloblasts - CD11b, CD15, CD16. B lymphoblasts – surface light chains kappa/lambda T lymphoblasts – Surface CD3
Enumeration of Blasts Flow cytometric count lower than manual count • Dilution with peripheral blood • Some blasts lack expression of CD34 and CD117 • CD45 expression may very • Flow cytometric count higher than manual count • Loss of NRBCS during red cell lysis. • FicollHypaque separation • Blast identifications may be difficult due to poor • preservation or may be disrupted during smear • preparation
Immunophenotypic markers Markers of Immaturity – TdT, CD34 Lineage Specific markers Myeloid - cMPO B cell - cCD22/cCD79a T cell - cCD3 Lineage Associated markers Myeloid - Common - CD13, CD33, CD117 - Other - CD11b, CD15 Monocytic - CD13, CD33, CD64, CD68, CD117, CD11b, CD14, CD4, cLysozyme Erythroid - CD36, CD71, CD105, CD235a (Glycophorin A), Hb Megakaryocytic - CD36, CD41, CD42, CD61 andCD62 B cell - CD19, CD22, CD20, cCD79a, CD10, cIgM, sIg T cell - Common - CD1a, CD2, CD5, CD7, CD10 - Other - CD4, CD8, CD3, NK cell - CD16, CD56, CD57, CD94, KIR PDC - CD123, CD4, CD56, CD68, CD33, CD43, BDCA, - Other on PB subset CD2, CD5, CD7
Lineage Infidelity markers (Leukemia associated immunophenotype; LAIP) Lymphoid markers in AML - CD7, CD56, CD2, CD5 and CD19. Myeloid markers in ALL – CD13, CD33, CD117, CD15 Other Markers useful for MRD detection Associated with AML – CD38, CD45, CD68, HLADR Associated with ALL – CD9, CD24, CD25, CD52, CD58, CD81, CD123
AML M2 t(8;21)(q22;q22) RUNX1-RUNX1T1
Biphenotypic or mixed lineage leukemia Borowitz M, Bene M, Harris N and Matutes E, (2008) Acute leukaemias of ambiguous lineage., World Health Organization Classification of Tumours IARC Press, Lyon, pp. 150–155.
Bi-lineal Leukemia EG Weir and MJ Borowitz. Leukemia (2007) 21, 2264–2270.
Role of flow cytometry in CLPD & MM • Diagnosis • Staging of lymphoma – Bone marrow involvement or body fluids • Prognostication eg Zap 70 in CLL • Minimal residual disease • Diagnosis of relapse