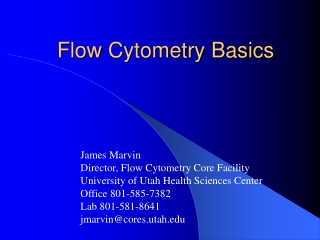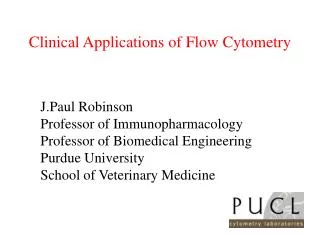
Principles of Flow Cytometry
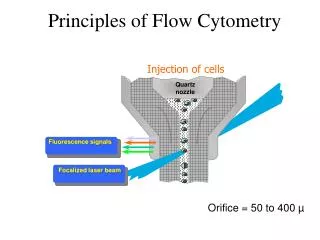
Quartz nozzle. Fluorescence signals. Focalized laser beam. Principles of Flow Cytometry. Injection of cells. Orifice = 50 to 400 µ. Photodiode. Fluorescence. Light can be measured at 90° : Side scatter + Fluorescence. Laser. Side scatter reflects the cell content. FITC. FITC. FITC.

Principles of Flow Cytometry
E N D
Presentation Transcript
Quartz nozzle Fluorescence signals Focalized laser beam Principles of Flow Cytometry Injection of cells Orifice = 50 to 400 µ
Photodiode Fluorescence Light can be measured at 90° : Side scatter + Fluorescence Laser Side scatter reflects the cell content
FITC FITC FITC FITC FITC FITC FITC FITC FITC FITC Fluorescence intensity Number of Events 101 102 103 104 Relative fluorescence intensity
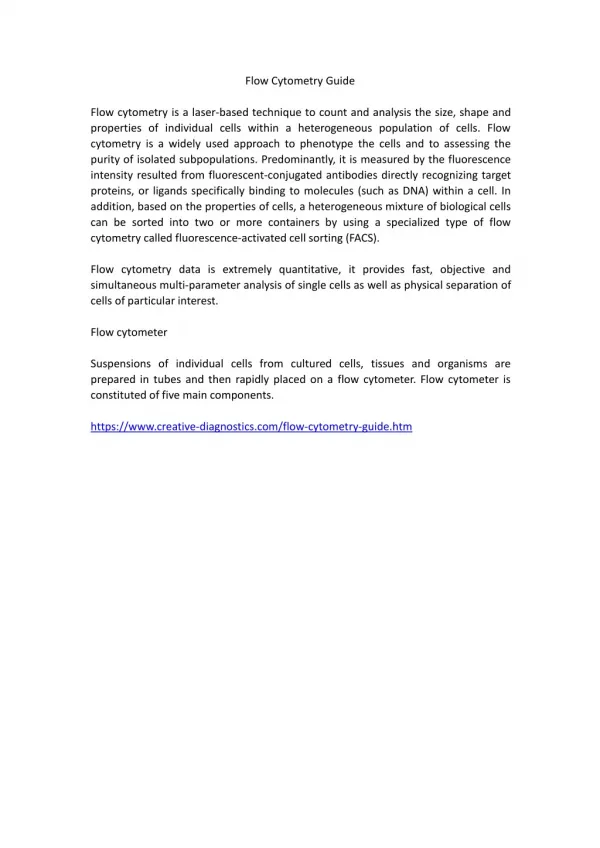
Basics of Flow Cytometry • Cells in suspension • flow in single-file through • an illuminated volume where they • scatter light and emit fluorescence • that is collected, filtered and • converted to digital values • that are stored on a computer Fluidics Optics Electronics
The automated Microscope Detector & Counter This primitive diagram shows the principle: Cells are passing the microscope objective, and an electronic circuit decides whether the cells is fluorescent or not. This is how a flow cytometer works! Waste Sample
LOW HIGH Hydrodynamic focussing in the cuvette Sample Sample Sheath Sheath Sample pressure low, small core stream. Good for DNA analysis High sample pressure, broader core stream. Bad for DNA analysis 1
Summary • Pressure (= Sheath Pressure) drives the sheath buffer through the cuvette, and the higher pressure in the sample tube(= Sample Differential) delivers the sample to the cuvette. • In the cuvette the principle of hydrodynamic focussing arranges the cells like pearls on a string before they arrive at the laser interception point for analysis • Hydrodynamic focussing cannot separate cell aggregates! Flow cytrometry is a technique that requires single cell suspensions
Basic opticsc A system of prisms and lenses directs the laser light to the interrogation point in the cuvette
Sample Sheath Laser delay • Umožňuje cross beam kompenzaci • Vyžaduje stabilní fluidics
Summary • Excitation light is steered with prisms and lenses to the interception point • Emitted light is collected using lenses and is split up with dichroic mirrors and filters
Tasks for the electronical system • Convert the optical signals into electonic signals (voltage pulses) • Digitise the data • Analyse Height (H), Width (W) and Area (A) of the pulse • Send the data to the analysis computer
t 1. 2. 3. Laser Voltage t Laser Voltage t Laser How a voltage pulse from the PMT is generated Voltage
Height, Area, and Width Pulse area(A) Pulse Height (H) Voltage 0 40 Time (µs) Pulse Width (W)
Threshold The threshold defines the minimal signal intensity which has to be surpassed on a certain channel. All signals with a lower intensity are not displayed and not recorded for later analysis.
Summary • During passing the laser voltage pulses are generated at the PMT • Amplifiers enhance the signals • Only signals passing the desired threshold(s) are analysed and recorded • The data are finally passed to the analysis computer connected to the cytometer
1976 FACS II When can I get one? 1980 FACS IV/440 Do you really need 4 colors? 1991 FACS Vantage Do you really need 5 colors? 1998 FACS Vantage SE Do you really need 6 colors? 2003 2000 FACS Aria FACS DiVa When can I get one? Do you really need 8 colors? An overview Instrument Introduced Most Frequently Heard Comments Year
Why always more colours? • More informations from Cell Phenotyping (Cell Surface Antigens) • around 300 CD Cell Surface Antigens • Many functional populations require 5 or more surface markers to be fully distinguished • Functional Assays • Cell Cycle (PI, BrdU, Intracellular Cyclins) • Apoptosis (Annexin-V, Active Caspase-3) • Ca++ Flux [Indo-1, FuraRed, Fluoro-4] • Cytokine Production • Intracellular Signaling (Rb phosphorylation) • Gene Reporter [Molecular] Assays • GFP, BFP, YFP, CFP Expression • LacZ Expression
What are the advantages / disadvantages? • Advantages • Save Time and Samples • (1) 6-color stain = (15) 2-color stains • Exponential increase in information • Data from (1) 6-color stain » (15) 2-color stains • Identify new/rare populations (<0.05%) • Internal controls • Problems • Must carefully choose combinations of fluorochrome conjugates • Not all reagents are available in all colors • Greater potential for errors in compensation • Proper controls required
Excitation- and Emissionspectra of dyes for the blue laser • Stejná excitace různá emise • Překryv spekter • (overlap) • Excitace jiným laserem?
Compensation www.bdbiosciences.com/spectra /
Uncompensated Compensated Over Compensated n d b n d b n b APC CD45 Where is the CD8 dull population?! PE-CY5-CD8 RPCI LFC Importance of ACCURATE Compensation n = negatives d = dim positives b = bright positives
Which marker for compensation? Small errors in compensation of a dim control (A) can result in large compensation errors with bright reagents (B & C). Use bright markers to setup proper compensation.
Hardware Compensation How to set compensation on the instrument
Setting compensation • Prepare single stained controls that have both a positive and negative population. • Adjust the PMT voltages so that the negative population is off the axis in every channel. • Align the centers of the positive and negative cell populations by matching the median fluorescence.
Setting compensation- PMT Voltage -Run unstained cells -Adjust the PMT voltages so that the negative population is off the axis in every channel. FL2-no stain FL1-no stain
Setting compensation - FITC single stain -Run single stained control (FITC stained only) -Adjust the compensation value so that positive and negative population have the same FL2 median fluorescence intensity. Uncompensated Compensated FL2-no stain FL2-no stain Median values both = ~3.2 FL1-FITC CD3 FL1-FITC CD3
Setting compensation - PE single stain -Run single stained control (PE stained only) -Adjust the compensation value so that positive and negative population have the same FL1 median fluorescence intensity. Compensated FL2-PE CD4 Median values both = ~2.5 FL1-no stain
Compensation Controls Single Stain Controls
Single Stain Controls - Which cells? Does not matter as long as: • The autofluorescence is the same in the negative and positive populations you are lining up. • eg, Pre-gate on lymphocytes if you are using CD8 FITC as a single stain control • The compensation values will be valid for ALL cell types, regardless of which type of cell is used to calculate the values. • The compensation is specific for the fluorochrome, not the cell type
Single Stain Controls - which reagents? Use the same reagent (Ab-fluorochrome conjugate) as used in the experimental sample… OR A different antibody may be substituted, as long as it is conjugated to the same fluorochrome. However…
Single Stain Controls - which reagents? Caveats for substituting reagents: • Controls should be as bright as possible • As bright or brighter than the experimental stains • GFP, CFSE, and FITC are NOT the same fluorochrome • even though they are all green! • With tandem dyes (Cy5PE/Cy7PE etc.) it is necessary to use the exact same reagent • spillover varies from reagent to reagent
Compensation of tandem-conjugates can differ from lot to lot
Using Antibody Capture Beads as single stained controls • Use same reagent as experimental sample • Lots positive • Small CV, bright • Some reagents won’t work (IgL, EMA/PI) • can mix with regular comps
Software Compensation Automated Tools for Setting Compensation
Compensation Tools • Must have single stained controls • Software calculated compensation for you! • Easy, accurate and quick. • Makes MULTI- Color compensation possible
Software Compensation Tools • Available on new generation machines • DakoCytomation’s Summit (version 4) • Coulter FC500 • BD Diva • Others • Post-acquisition software • FCS Express • FCS Press • WinList • FlowJo • Others
Take Away Lessons • Proper CONTROLS are essential • DON’T compensate by eye • Use Median to adjust the populations if you must do it manually • TRUST the software to do it for you • It does it quicker and more accurately
Polychromatická cytometrie Design experimentu a analýza Ústav imunologie, Klinika dětské hematologie a onkologie, UK 2.LF a FN Motol Praha Childhood Leukemia Investigation Prague -
Which fluorochrome to use? • Major Factors • Fluorochrome brightness • PerCP ≈ APC-Cy7 ≈ FITC << PerCP-Cy5.5 < PE-Cy7 < APC = PE-Cy5 < PE • Antigen density • Background staining of mAb • Inherent background (stickiness) of mAb • Antibody strength (Avidity) • Less antibody needed = less background • Amount of compensation required between conjugates • Single or multiple laser
Comparison of the dye intensity for the same marker Baumgarth, Roederer, JIM, 2000, A practical approach to multicolor flow cytometry for immunophenotyping
Spektra fluorochromů www.bdbiosciences.com/spectra /
Which fluorochrome for which marker? • In general, try to use brighter fluorochrome conjugates for duller antibodies or lower density antigens (e.g. activation antigens such as CD80, CD86, CD25, or CD28) • Use brighter reagents for staining cell populations with high autofluorescent backgrounds (e.g. granulocytes, monocytes, or activated lymphocytes) • Use duller conjugates (FITC or PerCP) for antigens expressed at high levels (e.g. B220 or CD4)
Grafické řešení „Loglinear transformation“ „Biexponencial display“ PE-TxRed – PE = 65% Zkreslení vlivem kompenzací Přesvit (spilover, spectral overlap) z PE do FITC je malý = malá kompenzace z PE do PE-TxRed je velký = velká komp. FITC PE PE-TxRed PE
Zkreslení vlivem kompenzací Je třeba promyslet odkud se dívat Obvyklé problémy: PE vs PE-TxRed, PE-Cy5 vs APC Nelze použít vždy histogram Nelze vždy použít čtverce či kvadranty Je třeba promyslet jak postavit gate (kontroly FMO) V silně komp. kanálech je menší rozlišení a horší kvantifikace
Design experimentu Na interpretaci dat myslet PŘEDEM Bez správných kontrol někdy interpretovat nelze Jak naložit se zkreslením komp. dat? Sestavit design experimentu tak, aby se předešlo potížím při analýze