Download
1 / 13
130 likes | 244 Views
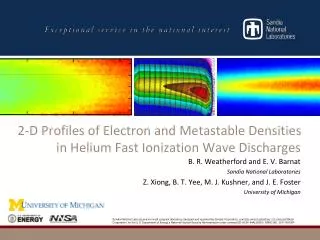
2-D Electron and Metastable Density Profiles Produced in Helium FIW Discharges. B. R. Weatherford and E. V. Barnat Sandia National Laboratories Z. Xiong and M. J. Kushner University of Michigan. Fast Ionization Waves (FIWs). Nanosecond -duration, overvoltage (> breakdown) E -fields

E N D
2-D Electron and Metastable Density Profiles Produced in Helium FIW Discharges B. R. Weatherford and E. V. Barnat Sandia National Laboratories Z. Xiong and M. J. Kushner University of Michigan
Fast Ionization Waves (FIWs) • Nanosecond-duration, overvoltage (> breakdown) E-fields Diffuse volume discharge at elevated pressures • High-energy electrons efficiently drive inelastic processes • Ideal for large volume, uniform, high pressure production of: • Photons • Charged particles • Excited species • Proposed Applications: • Pulsed UV light sources / laser pumping • High-pressure plasma chemistry • Plasma-assisted combustion • Runaway electron generation
Current Understanding of FIWs Increasing Pressure Helium FIW, 20 Torr, 11 kV Negative Polarity Positive Polarity Takashima (2011) Vasilyak (1994) • Axial FIW propagation studied extensively • Capacitive probes Average E-fields, e- density • Optical emission 2-D profiles, wave speeds • Laser diagnostics Spatially resolved E-fields • Radial variations important, but still unclear • Varying E-field? Higher density or Te? Photons? • Applications may require volume uniformity • What do profiles tell us about the physics?
Experimental Setup - Chamber • Discharge Tube: 3.3 cm ID x 25.4 cm long • HV electrode inside Teflon sleeve, grounded shield • Imaged area: 20-140 mm from ground electrode • Helium feed gas • Pressure 1-20 Torr • ~14 kV (open load) +HV pulses • 20 ns duration, 3 ns rise time • 1 kHz pulse rep rate
2-D LCIF Diagnostic Scheme Barnat (2009) • 2-D maps of electron densities acquired from helium line intensity ratios • Pump 23S metastables to 33P with 389 nm laser • Electron collisions transfer from 33P 33D • Image LIF @ 389 nm (33P-23S) and LCIF @ 588 nm (33D-23P) after the laser pulse • Ratio depends linearly on e- density
Electron Densities vs. Pressure Increasing Pressure Wavefront Motion Key Questions: What causes the transition in e- densities? Can we explain this with a model? • Density maps @ fixed rep rate & voltage, 1-16 Torr • ICCD delay time: 100 ns after FIW, 20 ns window • Peak densities on scale of 1011 cm-3 for all pressures • Low P center-peaked • High P wall-peaked • Max uniformity, ne at intermediate pressure
Metastable Densities vs. Pressure Increasing Pressure Wavefront Motion • Helium 23S metastable profiles, 1-16 Torr • Relative densities from LIF intensities • Laser absorption measurements for calibration (B. Yee) • Same general trends, but less drastic than ne • Center-peaked to volume-filling / uniform • Similar FIW decay lengths
Simulation Results - nonPDPSIM 16 Torr Profiles 1 Torr Profiles (Xiong and Kushner) • 2-D fluid simulation • Photon transport • Stepwise ionization • Plasma chemistry • EEDF calculated from two-term expansion of Boltzmann equation • Same voltage pulse shape as in experiment • Simulations produce similar results as LCIF • Ne ~ 1011-1012 cm-3 • Trend in radial profiles with variable pressure • Wave velocities ~ cm/ns
Electrons vs. Metastables ne NHe* ne NHe* He* Profiles - Experiment 16 Torr Profiles - Simulation Top: Experiment Bottom: Simulation • Key Questions: • Why are these profiles different? • What does this say about FIW physics? (Behind wavefront) • Experiment: ne, NHe* have different radial profiles @ high pressure • Metastables shifted to center • Model: ne, NHe* track each other • Model results rule out: • Volume photoionization • Photoelectrons from wall
E-field, Effective Te Distributions 1 Torr – Te and E 16 Torr – Te and E Axial & Radial E, 16 Torr Behind wavefront Axial & Radial E, 16 Torr Inside wavefront • Simulations Strong radial E near wall • Exceeds runaway e- threshold (~210 Td in He) • Radial E exceeds axial E in and behind FIW front • 1 Torr: Mean e- energy nearly uniform • E-field fills much of the volume • 16 Torr: Mean e- energy highest at wall • E-field drops rapidly away from wall • Electrons cool via collisions Wall Axis Wall Axis
Effect of Runaway Electrons Ionization, 23S Cross-sections 4 Torr, with collisional cooling 30 eV e-, constant energy Fixed energy vs. r captures pressure trend Initial Energies Electron cooling separated e- and He* profiles • σiz peaks near 150 eV, σHe* at 30 eV • Radial fast e- flux in cylindrical geometry competing processes: • Focusing of e- flux, scales as 1/r • Loss of “fast” flux via inelastic collisions • Cooling of fast electrons via elastic collisions • 1-D production profiles estimated due to radial runaway e- flux from wall
Summary • 2-D maps of electron and 23S metastable densities in a positive polarity He FIW measured using LCIF/LIF • Center-peaked ne at low pressure, wall-peaked at high pressure • Metastable profiles shift from center-peaked to volume-filling • Intermediate pressures highest densities and uniformity • 2-D fluid simulations capture similar trends in ne • Peak e- densities of 1011-1012 cm-3; shift in radial profiles • Predicts metastable distributions which track e- densities • Radial E-fields yielding runaway e- may explain the difference • Runaway electrons are difficult to capture in fluid model • Dropoff in E at high pressure fast e- from walls lose energy • High energy ionization; Lower energy metastable production • Energy decay along radius causes spatial separation in profiles
Thank you! Questions? Comments? This work was supported by the Department of Energy Office of Fusion Energy Science Contract DE-SC0001939.