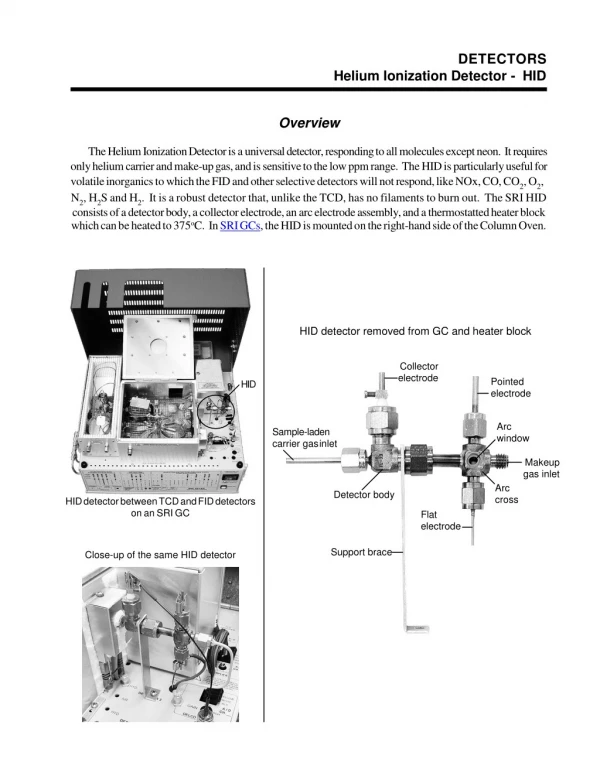
Download
1 / 37
390 likes | 580 Views
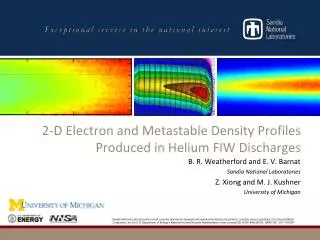
2-D Profiles of Electron and Metastable Densities in Helium Fast Ionization Wave Discharges. B. R. Weatherford and E. V. Barnat Sandia National Laboratories Z. Xiong, B. T. Yee, M. J. Kushner, and J. E. Foster University of Michigan. Overview. Background on Fast Ionization Waves

E N D
2-D Profiles of Electron and Metastable Densities in Helium Fast Ionization Wave Discharges B. R. Weatherford and E. V. Barnat Sandia National Laboratories Z. Xiong, B. T. Yee, M. J. Kushner, and J. E. Foster University of Michigan
Overview • Background on Fast Ionization Waves • Basic Description of FIW Propagation • Current Understanding of FIW Discharges • Experimental & Simulation Setup (w/ Xiong & Kushner, U. Mich.) • Discussion of Results • Propagation Velocity • Electron Density Profiles • Metastable Density Profiles • Calculated Electric Fields • Influence of Radial E-Fields on FIW Profiles • Laser Absorption Spectroscopy Study (w/ Yee & Foster, U. Mich.) • Summary
Fast Ionization Waves (FIWs) • Nanosecond-duration, overvoltage (> breakdown) E-fields Diffuse volume discharge at elevated pressures • Large volume, uniform, high pressure production of:Photons, charged particles, and excited species • Interesting Science: • High voltage + short timescales + fast wave speeds = Hard to capture! • Large values of E/N Efficiently drives ionization/excitation processes • Interesting Applications: • Pulsed UV light sources / laser pumping • High-pressure plasma chemistry • Plasma-assisted combustion • Runaway electron generation
FIW Propagation – Positive Polarity Pre-Pulse Conditions • High voltage anode, grounded cathode; coaxial geometry • Grounded outer conductor in contact w/ cathode • FIW always starts at powered electrode • Positive polarity FIWs: trace background ionization needed
FIW Propagation – Positive Polarity Application of +HV Pulse • Applied voltage accelerates electrons toward anode • Reverse-directed avalanche electron multiplication • Electrons move to shield potential @ anode • Region vacated by electrons = positive space charge • Photons move ahead of wavefront, add to preionization
FIW Propagation – Positive Polarity Ionization Wavefront Propagation • Process continues along length of the tube • Potential gradient moves away from anode • FIW wavefront = moving region of positive space charge + ionization • Residual plasma remains behind wavefront • Weak fields relatively little excitation
Current Understanding of FIWs Increasing Pressure Helium FIW, 20 Torr, 11 kV Negative Polarity Positive Polarity Takashima (2011) Vasilyak (1994) • Axial FIW propagation studied extensively • Capacitive probes Average E-fields, e- density[1] • Optical emission 2-D profiles, wave speeds[2-3] • Radial variations important, but still unclear • Varying E-field? Higher density or Te? Photons? • Applications may require volume uniformity • What process causes the FIW shape to change?What do profiles tell us about the physics?
Experimental Setup - Chamber • Discharge Tube: 3.3 cm ID x 25.4 cm long • Coaxial layout: low inductance • HV electrode inside Teflon sleeve, grounded shield • Imaged area: 20-140 mm from ground electrode • Helium feed gas • Pressure 1-20 Torr • ~14 kV (open load) +HV pulses • 20 ns duration, 3 ns rise time • 1 kHz pulse rep rate
2-D LCIF Diagnostic Scheme Barnat (2009) • 2-D maps of electron densities acquired from helium line intensity ratios • Pump 23S metastables to 33P with 389 nm laser • Electron collisions transfer from 33P 33D • Image LIF @ 389 nm (33P-23S) and LCIF @ 588 nm (33D-23P) after the laser pulse • Ratio depends linearly on e- density
Timing & High Voltage Waveform Interrogation Region • Reflected energy: ~85% (V²) • Long HV cable (15.4 m)used to separate incident& reflected pulses • ICCD opticallysynchronized to FIW • t0 = initial detection of 389 emission without laser • Reflected pulse: t = 170 ns • Interrogation: 100-120 ns • Timing jitter ~ 2-3 ns • Laser duration ~ 5 ns • Images accumulated from repeatable pulses Forward Pulse Reflected Pulse
2-D Simulation Setup - nonPDPSIM (Xiong and Kushner) • 2-D fluid model • Radiation-photon transport • Includes stepwise ionization • EEDF from two-term expansion of Boltzmann equation • Same pulse shape as experiment • Approx. open load pre-pulse:14 kV peak applied at anode • Assumptions: • 0.1% O2 concentration (photoionization) • Initial ne = 108 cm-3
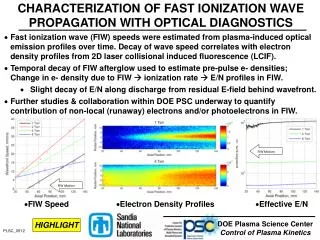
Wavefront Motion Results - FIW Velocities = 389 nm = 588 nm • FIW speed estimated from optical emission intensities vs. time • 389 nm & 588 nm emission • FIW Speed: 5 – 20 mm/ns • Peaks @ moderate Pgas • 1 Torr: stalls @ x = 40 mm • Decay along tube length • Due to residual E-field behind wavefront Distance to Cathode, mm
FIW Speed and ne: Comparison • Model & experiment agree in several ways: • Comparable wave velocities: • Experiment: 0.5 – 2.0 cm/ns, peaks at 2-4 Torr • Simulation: 0.5 – 1.5 cm/ns, peaks at 8 Torr • Trend in e- density and ionization rate: • Peaks at intermediate pressure, then decreases • Transition from center-heavy to wall-heavy “hollow” profile • Weak ionization behind wavefront, conserves spatial profile • Absolute densities are sometimes different • Experiment: 5x10¹⁰ – 3x1011 cm-3 • Simulation: 5x10¹⁰ – 8x1012 cm-3 • Model e- and He* profiles always identical
Density Profiles – 1 Torr LCIF Measurements • Electrons, metastables are center-peaked • In both LCIF and Model • Production stops @ x = 40 mm • Corresponds with decay of FIW speed • Weak ionization in residual plasma • Electrons, metastables track one another in simulation Ne,cm-3 NHe*, arb. Simulation Results Ne,cm-3 Se,cm-3-s-1
Density Profiles – 4 Torr LCIF Measurements • More volume-filling than @ 1 Torr • Maximum electron, metastable densities • Corresponds to maximum FIW speeds in experiment • Wave traverses the entire gap Ne,cm-3 NHe*, arb. Simulation Results Ne,cm-3 Se,cm-3-s-1
Density Profiles – 8 Torr LCIF Measurements • Electron densities shift to off-center peak • Asymmetry due to slight offset in outer conductor? • Radial shift predicted by simulation • Metastable profile still volume-filling • Residual ionization follows ne profile Ne,cm-3 NHe*, arb. Simulation Results Ne,cm-3 Se,cm-3-s-1
Density Profiles – 16 Torr LCIF Measurements • Electron densities strongly wall-peaked • Simulation shows excellent agreement in electron profile shape • Metastable densities volume-filling, with slight shoulder off-axis Ne,cm-3 NHe*, arb. Simulation Results Ne,cm-3 Se,cm-3-s-1
Radial Profiles – Experimental Low Pressure: Center-peaked ne and He* 1 Torr High Pressure:Broad He* profile 140 mm 20 Torr High Pressure:Concave ne profile 75 mm X = 10 mm
Electrons vs. Metastables ne NHe* ne NHe* He* Profiles - Experiment 16 Torr Profiles - Simulation Top: Experiment Bottom: Simulation • Key Questions: • Why are these profiles different? • What does this say about FIW physics? (Behind wavefront) • Experiment: Different ne, NHe* radial profiles @ high pressure • Metastables shifted to center • Model: ne, NHe* track each other • Model results rule out: • Volume photoionization • Photoelectrons from wall
Energy Deposition in Wavefront Radial E Radial E-field drops rapidly away from wall Radial E-field fills much of the volume Axial E Electric field exceeds runaway e- threshold (~210 Td in He) 1 Torr 16 Torr • Simulations Strong radial E near wall • Radial E exceeds axial E just behind FIW front
Cross Sections & Path Lengths • σiz peaks near 150 eV, σHe* near 25 eV • Path lengths drastically diverge above 30 eV Cross-sectionsGround Ionization, Metastable Mean Free Paths vs. Pressure Ionization & Metastable Ionization Metastable Tube Diameter 1 Torr 4 Torr 16 Torr
1-D Fast Electron Model • Simple 1-D model assumptions: • Discretize radial position & electron energies @ each position • Initial fast e- flux, radially inward, originating @ wall: • Electrons lose energy via collisions: • Elastic, Excitation from ground state, Ionization from ground state • Flux Conservation: • Gain & Loss Terms: • Solve (iteratively) for to find:
Model Results: Fixed Initial Energy Varied Pressure: 55-65 eV e- • Sample of results from band of 55-65 eV initial energy e- flux • All curves normalized to 1 @ wall • Competition of effects: • Low Pressure: 1/r focusing of flux • High Pressure: Attenuation & e- Cooling • 0.5 Torr: • Se center-peaked • SHe* also center-peaked • 2 Torr: • Se more uniform • SHe* center-peaked, but broad • 8 Torr: • Se wall-peaked • SHe* peaks off-axis, near wall
Model Results: Fixed Pressure Varied Energy, 8 Torr • Pressure fixed @ 8 Torr • Solved for various energy “bands” at wall, 10 eV wide • Little divergence for 20 eV electrons • Higher energies: • Short Ionization Pathlength • Long Metastable Pathlength • Divergence in Profiles • Spatial separation is influenced by: • Neutral Pressure • Fast e- Energy Distribution
1-D Electron Model Limitations • Not included: • Stepwise ionization • Randomization of electron motion (2-D) • Electrons which pass through origin • Axial component of fast electron flux • But still qualitatively captures… • Center-to-wall transition in radial profiles • Low pressure: • Center-peaked e- density and metastables • Metastables slightly broader, as seen in LCIF • High pressure: • Wall-peaked e- densities • Broadened metastable profiles, closer to axis than e- profiles • What does a more sophisticated model say?
Laser-Absorption Spectroscopy- B. Yee & J. Foster • Parallel effort to study FIW processes – Ph.D. Thesis for B. Yee • Advantages • Non-perturbing • Excellent time resolution (~ns) • Absolute measurement • Simple calibration • Difficulties • Pathlength-integrated measurement • Optimizing detector response sensitivity • Electrical noise The Goal: Use absolute metastable densities + plasma induced emission to clarify e- energies (and E/N?) during FIW propagation.
Laser Absorption Setup • DFB laser swept (in wavelength) across transition from He 23S • 1083 nm (23S 23P) • Laser absorbed by metastables in plasma – quantified with PDs • Absorption curve fit gives metastable: • Densities • Temperatures • Drifts DFB: Distributed Feedback Laser FI: Faraday Isolator ND: Neutral Density Filter AP: Aperture PD: Photodiode
Initial Measurements Sample Location During Density Buildup Negligible Gas Heating Reflected Pulses (Long Decay) Deposited Energy
Interpretation of LAS Data • Immediate temporal evolution of NHe* • Ground-Metastable excitation rates (from pulse duration & initial ne) • Effective e- Temperature & E/N (if electrons are local) • Some kind of info on e- energies in wavefront (even if nonlocal) • Plasma induced emission (PIE) measured w/ monochromator more constraints on energy distribution • Global Model/CRM under development (Yee & Foster) • Energy balance to calculate e- energies from applied pulse • Collisional radiative model PIE from energies & densities • Measure metastable & electron densities • Input densities into CRM, calculate emissions of various transitions • Compare to measured PIE does it match what’s expected from E/N? If not, why? validity of E/N in FIW wavefronts.
First-order Example During Pulse Buildup If valid? E/N
Summary • 2-D maps of electron and 23S metastable densities in a positive polarity He FIW measured using LCIF/LIF • Center-peaked ne at low pressure, wall-peaked at high pressure • Metastable profiles shift from center-peaked to volume-filling • 2-D fluid simulations capture similar trends in ne • Center-to-wall transition, trends in FIW velocity, ne profiles • Predicts metastable distributions which track e- densities • Radial E-fields yielding runaway e- may explain the difference • Strong E-field @ wall (~kTd) = source of fast “runaway” electrons • Dropoff in E at high pressure e- from walls lose energy • High energy ionization; Lower energy metastable production • Energy decay along radius causes spatial separation in profiles • Laser absorption measurements of He* + CRM may yield more information on electron energetics in the FIW
Thank you! Questions? Comments? This work was supported by the Department of Energy Office of Fusion Energy Science Contract DE-SC0001939. References: 1. S. M. Starikovskaia, N. B. Anikin, S. V. Pancheshnyi, D. V. Zatsepin, and A. Yu. Starikovskii. Plasma Sources Sci. Tech., 10:344–355, 2001. 2. K. Takashima, I. V. Adamovich, Z. Xiong, M. J. Kushner, S. Starikovskaia, U. Czarnetzki, and D. Luggenholscher. Phys. Plasmas, 18:083505, 2011 3. L. M. Vasilyak, S. V. Kostyuchenko, N. N. Kudryavtsev, and I. V. Filyugin. Phys. Uspekhi, 37:247-269, 1994.
Electron Densities vs. Pressure Increasing Pressure Wavefront Motion Key Questions: What causes the transition in e- densities? Can we explain this with a model? Density maps @ fixed rate & voltage, 1-16 Torr Peak densities on scale of 1011 cm-3 for all pressures Low P center-peaked High P wall-peaked Volume-filling, max. ne at intermediate pressure
Metastable Densities vs. Pressure Increasing Pressure Wavefront Motion • Helium 23S metastable profiles, 1-16 Torr • Relative densities from LIF intensities • Laser absorption measurements for absolute values (B. Yee) • Similar trends, but less drastic than ne • Center-peaked to volume-filling / uniform • Similar FIW decay lengths
Electron Profiles vs. Pressure 1 Torr 4 Torr t = 100 ns 8 Torr 16 Torr
Time Dependence After FIW Electron Density 23S Metastable Density • Shape of radial profile established by 40 ns • Ionization in residual plasma conserves shape after initial formation • Profile dictated by energy deposition in wavefront
Line Profiles Absorption lines fit to Voigt profile w/ Doppler & Pressure Broadening