Download
1 / 1
10 likes | 102 Views
The study focuses on predicting lipophilic UV filter absorption using a simple method through a mathematical model, aiming to improve sunscreen product safety and efficacy. The results and discussion cover the methodology, mathematical models, and comparison between experimental and predicted UV filter concentrations.

E N D
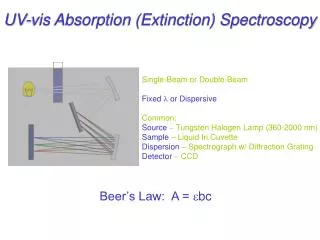
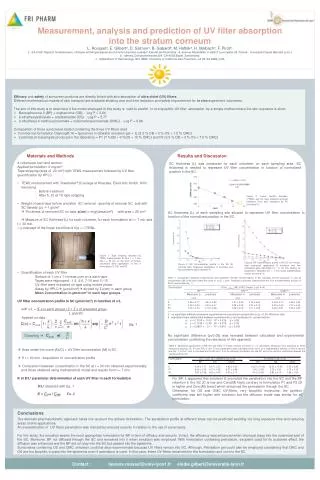
Measurement, analysis and prediction of UV filter absorption into the stratum corneum L. Roussela, E. Gilberta, D. Salmona, B. Gabardb, M. Hafteka, H. Maibachc, F. Pirota. a : EA 4169 "Aspects fondamentaux, cliniques et thérapeutiques de la fonction barrière cutanée"-Faculté de Pharmacie - 8, avenue Rockefeller; F-69373 Lyon cedex 08, France - Université Claude Bernard Lyon-I. b : Iderma, Dornacherstrasse324, CH-4053 Basel, Switzerland. c : Department of Dermatology, Box 0989, University of California San Francisco, CA 94143-0989, USA • Efficacy and safety of sunscreen products are directly linked with skin absorption of ultra-violet (UV) filters. • Different mathematical models of skin transport are available allowing cost and time reduction and safety improvement for in vivo experiment volunteers. • The aim of this study is to determine if the model employed in this study is valid to predict in vivo lipophilic UV filter absorption by a simple method where the skin exposure is short. • Benzophenone-3 (BP) = oxybenzone (OB) - Log P = 3,64 • 2-ethylhexylsalicylate = octylsalicylate (OS) - Log P = 5,77 • 2 ethylhexyl-4-methoxycinnamate = octylmethoxycinnamate (OMC) - Log P = 5,66 • Composition of three sunscreens tested containing the three UV filters cited • Commercial formulation Daylong® 16 = liposomes in oil/water emulsion-gel = E (3.5 % OB + 3 % OS + 7.5 % OMC) • 2 petrolatum based gels produced in the laboratory = P1 (7 %OB + 6 %OS + 10 % OMC) and P2 (3.5 % OB + 3 % OS + 7.5 % OMC) Results and Discussion Materials and Methods • 4 volunteers men and women. • Applied formulation: 2 mg/cm² • Tape stripping (area of 20 cm²) with TEWL measurement followed by UV filter quantification by HPLC. • TEWL measurement with Tewameter® (Courage et Khazaka, Electronic Gmbh, Köln, Germany) • Before treatment • After 5, 10 et 15 tape stripping • Weight of each tape before and after SC removal : quantity of removal SC and with SC density (ρ) = 1 g/cm3 • Thickness of removed SC on tape x(cm) = m(g)/area(cm3) with area = 20 cm3 • Measure of SC thickness (L) for each volunteer, for each formulation at t = 7 min and t = 30 min. • = y-intercept of the linear trend line of f(x) = 1/TEWL • Quantification of each UV filter • Surface of 1 cm x 1 cm was cute on a each tape • Tapes were regrouped : 1-3, 4-6, 7-10 and 11-15 • UV filter were extracted on tape using mobile phase • Assay by HPLC (µmol/cm²) divided by Ʃx(cm)in each group • Mean Concentration in µmol/cm3 in each tape groups. • UV filter concentration profile in SC (µmol/cm3) in function of x/L • with x/L = (Ʃ x in each group) / 2 + Ʃ x of preceded group • L spécific • Area under the curve (AUC) = UV filter concentration (M) in SC • If t = 30 min : Acquisition of concentration profile • Comparison between concentration in the SC at t = 30 min obtained experimentally and those obtained using mathematical model and results from t = 7 min. • K et D/L² parameter determination of each UV filter in each formulation • D/L² obtained with Eq.1 SC thickness (L) was measured for each volunteer, on each sampling area. SC thickness is needed to represent UV filter concentration in function of normalized position in the SC. Figure 2. Linear relation between 1/TEWL and SC tape stripping removal thickness 7min after treatment by P2 (volunteer 1), SC thickness (L) of each sampling site allowed to represent UV filter concentration in function of the normalized position in the SC. Figure 1. Tape stripping followed by TEWL measurement at time t = 7 min and t = 30 min on the back of human volunteers after application of the 3 formulations E, P21 and P2. Figure3. BP Concentration profile in the SC 30 minutes after cutaneous application of emulsion and two petrolatum-gels calculated for t= 30 min basing on parameters obtained at t = 7 min using mathematical model, (volunteer 1). Figure 2. BP Concentration profile in the SC 30 minutes after cutaneous application of emulsion and two petrolatum gels (volunteer 1). Table 1. Comparison between experimental and predicted UV-filter concentrations in SC following 30-min exposure in vivo as concentration (M) is the area under the curve of f(x/L) = conc. Predicted curve was obtained with the fit of a mathematical solution of Fick's second law (eq. 1). Applied on data : † : no significant difference between experimental and predicted concentrations (p > 0.05; Wilcoxon test). ¥: significant linear relationship between experimental (y) and predicted (x) concentrations : a: y = 0.7169 x - 0.09 R2 = 0.819 p < 0.05 b: y = 0.7198 x - 0.49 R2 = 0.819 p < 0.05 c: y = 0.8827 x - 0.11 R2 = 0.819 p < 0.005 Eq. 1 Obtaining Cx=0 et No significant difference (p>0.05) was revealed between calculated and experimental concentration confirming the relevance of this approach. Table 2. Absorption parameters of BP, OS and OMC in human stratum corneum (n = 4 volunteers) following 7-min exposure to three sunscreen products (E, P1 and P2) in vivo. Those parameters were calculated from the fit of a mathematical solution of Fick's second law (Eq. 1) to the 7-min in vivo data and K with eq.2. D is the diffusivity coefficient into the SC and K the partition coefficient between the vehicle and the SC.. For BP, it appeared that emulsion E promoted the penetration into the SC and the BP retention in the SC (D is low and Conc(M) high) contrary to formulation P1 and P2 (D is higher and Conc(M) lower)which enhanced the permeation through the SC. Otherwise, for OS and OMC UV-filters, very lipophilic molecules, the partition coefficient was still higher with emulsion but the diffusion inside was similar for all formulation. Eq. 2 Conclusions The dermato-pharmacokinetic approach takes into account the actives formulation. The penetration profile at different times can be predicted avoiding too long exposure time and reducing areas of skin applications. An overestimation of UV filters penetration was noticed but ensures security in relation to the use of sunscreens. For this study, the emulsion seems the most appropriate formulation for BP in term of efficacy and security. In fact, the efficiency was enhanced when chemical stays into the outermost part of the SC. Moreover, BP not diffused through the SC and remained into it when emulsion was employed. With formulation containing petrolatum, excipient used for its occlusive effect, the diffusion was enhanced and the BP did not stay into the SC but passed into the epidermis. Sunscreens containing OS and OMC, emulsion could be also recommended because UV filters remain into SC. Although, Petrolatum gel could also be employed considering that OMC and OS are too lipophilic to pass into the epidermis even if petrolatum is used. In this case, these UV filters remained into the formulation and not into the SC. Contact : laurene.roussel@univ-lyon1.fr elodie.gilbert@universite-lyon.fr