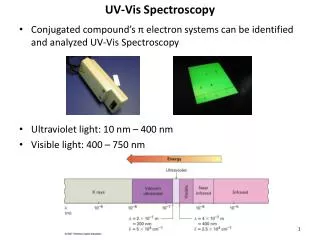
Topic 2 UV-VIS Absorption Spectroscopy
Topic 2 UV-VIS Absorption Spectroscopy. Electromagnetic spectrum. http://mail.colonial.net/~hkaiter/electromagspectrum.html. Theory of Electromagnetic Radiation. Electromagnetic Radiation Wave properties: v = c c = velocity of light (3.0x10 8 ms -1 in vacuum) = wavelength (m)
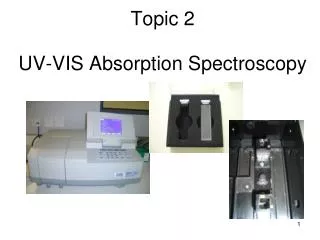

Topic 2 UV-VIS Absorption Spectroscopy
E N D
Presentation Transcript
Electromagnetic spectrum http://mail.colonial.net/~hkaiter/electromagspectrum.html
Theory of Electromagnetic Radiation Electromagnetic Radiation • Wave properties: v = c c = velocity of light (3.0x10⁸ ms-1 in vacuum) = wavelength (m) v = frequency (cycles/s, cps, Hz)
Theory of Electromagnetic Radiation Electromagnetic Radiation • Particle properties: E = energy of quantum (J) h = Planck’s constant (6.63 x 10⁻³⁴ J.s) v = frequency
Theory of Electromagnetic Radiation • Photon energy can also be rewritten as:
E1 (excited state) E0 (ground state) Theory of Electromagnetic Radiation Absorption of Radiation • The energy difference between the two energy states, E1 and Eo, must be equal to the energy of the absorbed radiation (E = hv).
Theory of Electromagnetic Radiation Atomic Absorption • When atoms absorb radiation, only e-s are excited. • Line spectrum can be observed. • Electronic transition - The transition of an e- between two orbitals.
Theory of Electromagnetic Radiation Molecular Absorption • Molecules undergo three types of quantized transitions when excited by ultraviolet, visible, & infrared radiation: Electronic transition Vibrational transition Rotational transition Decrease in energy
Absorption and Emission • Absorption of Radiation • When light passes through an object, the object will absorb certain of the wavelengths, leaving the unabsorbedwavelengths to betransmitted. • These residual transmitted wavelengths will be seen as a colour. • The absorption can be detected by suitable detectors
Absorption and Emission UV Visible spectrum
Question? • Why is the red solution red? Because the object absorbs green component from the incoming white radiation and thus transmits red components.
Absorption and Emission Example Na (1s22s22p63s1), excitation of the 3s electron to the 3p state requires energy corresponding to a wavelength of 589.3 nm (yellow light).
5p 4p 3p 590 nm 285 nm 330 nm 3s Absorption and Emission Partial energy-level diagram for sodium, showing the transitions resulting from absorption at 590, 330 and 285 nm
Absorption and Emission A plot of the amount of radiation absorbed by a sample as a function of the wavelength is called an absorption spectrum
Absorption and Emission • Emission of a photon occurs when an analyte in a higher energy state returns to a lower energy state. • The higher energy state can be achieved by heat, photon and chemical reaction • The emission of the sample itself provides the light and the intensity of the light emitted is a function of the analyte concentration. • When molecules or atoms are in the excited state, they are very unstable and will lose their energy of excitation and drop back to a lower energy state or the ground state – relaxation. • The excess energy is released in the form of electromagnetic radiation, heat, or both.
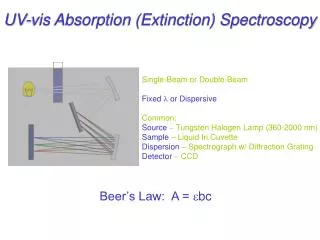
Transmittance & Absorbance The Beer’s Law Po P Po = initial radiant power P = final radiant power Transmittance: T = P / Po , % Transmittance: %T = P / Po x 100% Absorbance: L mol-1 cm-1 cm mol L-1
Transmittance & Absorbance The Beer’s Law Transmittance (T): the ratio of the radiant power (P) in a beam of radiation after it has passed through a sample to the power of the incident beam (Po). Absorbance (A) is also known as the optical density, = log (base 10) of the reciprocal of the transmittance (T).
Exercise 2 What values of absorbance correspond to 100%T, 10%T, and 1%T? Solution: 100%T, 10%T, and 1%T correspond to transmittances of 1.00, 0.10 and 0.010. From the definition of A: 100%T has A = -log1 = 0 10%T has A = -log0.10 = 1.0 1%T has A = -log0.010 = 2.0
The Beer’s Law Absorption of radiant energy When radiation of specified wavelength is passed through a solution containing only one solute which absorbs that wavelength, the absorbance (no units) can be calculated by: A = Absorbance b = Optical path distance (cm) = Molar absorptivity (M-1cm-1) c = Concentration (M) A = e b c
Exercise 3 Monochromatic light was passed through a 1.00 cm cell containing a 0.0100M solution of a given substance. The absorbance obtained was 0.245. Calculate the molar absorptivity of the substance.
0.7 0.6 0.5 0.4 0.3 Absorbance 0.2 0.1 A = bc 0 0 2 4 6 8 10 Concentration The Beer’s law
The Beer’s Law Deviation from Beer’s Law Non-linear curve may be obtained due to: • Fundamental limitations of Beer’slaw • Chemical deviations • Instrumental deviations
Ideal Calibration Curve Positive deviation Absorption Negative deviation Concentration The Beer’s Law
The Beer’s Law Fundamental limitations of Beer’slaw Beer’s Law is only valid for: • Lowconcentration of analyte. • At high conc. (usually >0.01M): the individual particles of analyte no longer behave independently of one another The absorbance changes - value of changed - deviation from Beer’s Law High concentration of solute may result in a shift of maximum absorption, and may also change the value of the molar absorptivity,.
The Beer’s Law • depends on sample’s refractive index (RI). • Thus, may change at high conc but at low conc, RI remains essential constant. • Calibration curve will be linear. 2. Chemical limitations of Beer’s law • Occur for absorbing species that are involved in an equilibrium reaction. For example in the case of weak acid and conjugate base
In higher dilution, or higher pH, more ionised benzoate is formed, thusthe absorbance at 273nm decreases. On the other hand, at lower pH, benzoic acid remains in its unionised form whereby the absorbance at 273 nm is optimised. The Beer’s Law Example Benzoic acid exists as a mixture of ionised and unionisedform: C6H5COOH + H2OC6H5COO- + H3O+ (max = 273 nm) (max = 268nm)
A 268nm 273nm Conc The Beer’s Law
The Beer’s Law 3. Instrumental deviations • Beer’s law is only valid for monochromatic radiation. • The output from a continuous source (D2 lamp) will always produce a specific band width (about +5 nm). • e.g. 220 nm may imply 215 to 225 nm
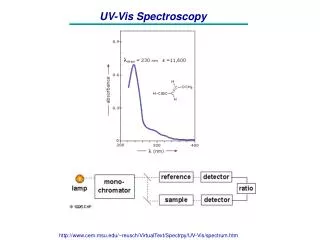
Source Monochromator Sample Detector Meter Components of Instrumentation for Optical Spectroscopy
http://analytical.biochem.purdue.edu/~courses/undrgrad/221/wwwhttp://analytical.biochem.purdue.edu/~courses/undrgrad/221/www board/handouts/supplemental/spectrophotometry.pdf Components of Instrumentation for Optical Spectroscopy Components Most spectroscopic instruments are made up of :1. source 2. wavelength selector3. sample container 4. detector5. signal processor and readout
Components of Instrumentation for Optical Spectroscopy Spectroscopic sources A good radiation source should have the following characteristics : • the beam emits radiation over a wide rangeof the spectrum. • sufficient intensity to be detectable. • stable
Components of Instrumentation for Optical Spectroscopy • Line source – consists of one or more very narrow bands of radiation whose wavelengths are known exactly (Hollow cathode lamp) • Continuous source – produces radiation of all wavelengths within a certain spectral region (D2 lamp)
(a) A deuterium lamp. (a) A tungsten lamp. Components of Instrumentation for Optical Spectroscopy • Source of radiant energy for: • Visible region: tungsten filament lamp • UV region: deuterium discharge lamp (D2) [Picture taken from Analytical Chemistry by Gary D. Christian Page 530 and 531]
Components of Instrumentation for Optical Spectroscopy Wavelength selector • Monochromator (Monochrome = “one colour”) to spread out or disperse light into its component wavelengths and select the required wavelength for analysis.
Components of Instrumentation for Optical Spectroscopy • Function of monochromator • Restricts the wavelength that is to be used to a narrow band • Enhance the selectivity and sensitivity of an instrument • Narrow bandwidth => better adherence to Beer’s law • Not possible to produce radiation of a single wavelength
Nominal Wavelength %T Effective bandwidth ½ peak height wavelength Components of Instrumentation for Optical Spectroscopy Typical output of a wavelength selector
Components of Instrumentation for Optical Spectroscopy • Components of a monochromator: • Entrance slit (restrict unwanted radiation) • Dispersing element (separate the wavelengths of the polychromatic radiation) • prism • reflection grating • Exit slit – adjustable (control the width of the band of wavelengths)
Bunsen prism monochromator Components of Instrumentation for Optical Spectroscopy [Picture taken from Fundamentals of Analytical Chemistry by Douglas A. Skoog, Donald M. West and F. James Holler Page 536]
Components of Instrumentation for Optical Spectroscopy Grating Monchromator [Pcture taken from Modern Analytical Chemistry by David Harvey, pg 378]
Components of Instrumentation for Optical Spectroscopy • Sample container • Must be transparent in the wavelength region being measured • UV-VIS spectroscopy • – UV region: cell or cuvette of quartz • VIS region: cell or cuvette of quartz/glass/plastic
Components of Instrumentation for Optical Spectroscopy • Cells should be optically matched (in pair). • Selection of cells depends on: - wavelength of radiation used - amount of sample available - nature of sample liquid (aqueous / organic) or gas
[Picture taken from Analytical Chemistry by Gary D. Christian Page 427] Some typical UV and visible absorption cells Components of Instrumentation for Optical Spectroscopy • Size of curvette = 1cm x 1cm (square base) • Volume used= 0.5ml to 2ml depending on the sample size.
Components of Instrumentation for Optical Spectroscopy Detector • Photons are detected by: • Photoemission or • Photoconduction All photon detectors are based on the interaction of radiation with a reactive surface to produce electrons (photoemission) or to promote electrons to energy states in which they can conduct electricity (photoconduction). Only UV, visible and near-IR radiation have sufficient energy to cause these processes to occur.
Components of Instrumentation for Optical Spectroscopy Photomultiplier tubes A photomultiplier contains a photo-emissive cathode and several anodes (dynodes) in a vacuum. The cathode is coated with an easily ionized material such as alloys of alkali metals (K, Na, Ca, Mg) with Sb, Bi and / or Ag. A photon falling on the surface of the cathode causes the emission of an electron, provided the photon is sufficiently energetic to ionize the material. The signal is amplified by the process of secondary emission (as shown on next slide). The electron amplification depends on the voltage.
Quartz Window Photocathode Light e- Dynode 1 Dynode 2 anode current Components of Instrumentation for Optical Spectroscopy • Photomultiplier Tube
Components of Instrumentation for Optical Spectroscopy • The emitted electrons accelerate towards the dynode 1, which has higher voltage than cathode. • Upon striking the dynode 1, each accelerated photoelectron produces more electrons. These electrons again accelerated to dynode 2, which again has a higher voltage than dynode 1. This results in electron amplification where it is finally collected at anode to measure the current electronically. • Photomultiplier Tube
Optical Instruments • Single Beam - • Sample and reference cells are read at differenttime. • Recalibration with the blank is necessary periodically due to fluctuations and wavelength changes from the radiation source. • Double Beam - • Monochromatic beam is split into two components. (one beam for sample, one beam for reference)
Single-Beam Instruments [Picture taken from Fundamentals of Analytical Chemistry by Douglas A. Skoog, Donald M. West and F. James Holler Page 553] Optical Instruments
Double-beam Instrument [Picture taken from Fundamentals of Analytical Chemistry by Douglas A. Skoog, Donald M. West and F. James Holler Page 553] Optical Instruments