Chapter 14 Waiting Lines and Queuing Theory Models
250 likes | 754 Views
Chapter 14 Waiting Lines and Queuing Theory Models. Learning Objectives. Students will be able to Describe the trade-off curves for cost-of-waiting time and cost-of-service. Understand the three parts of a queuing system: the calling population, the queue itself, and the service facility.

Chapter 14 Waiting Lines and Queuing Theory Models
E N D
Presentation Transcript
Chapter 14 Waiting Lines and Queuing Theory Models 14-1
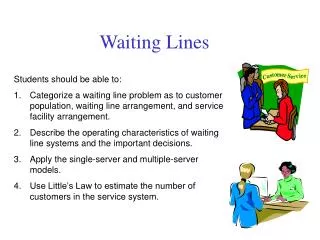
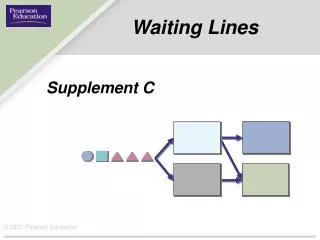
Learning Objectives Students will be able to • Describe the trade-off curves for cost-of-waiting time and cost-of-service. • Understand the three parts of a queuing system: the calling population, the queue itself, and the service facility. • Describe the basic queuing system configurations. • Understand the assumptions of the common models dealt with in this chapter • Analyze a variety of operating characteristics of waiting lines. 14-2
Chapter Outline 14.1 Introduction 14.2 Waiting Line Costs 14.3 Characteristics of a Queuing System 14.4 Single-Channel Queuing Model with Poisson Arrivals and Exponential Service Times 14.5 Multiple-Channel Queuing Model with Poisson Arrivals and Exponential service Times 14.6 Constant Service Time Model 14.7 Finite Population Model 14-3
Chapter Outline – cont. 14.8 Some General Operating Characteristics Relationships 14.9 More Complex Queuing Models and the Use of Simulation 14-4
Queuing Costs and Service Levels Total Expected Cost Optimal Service Level Cost of Providing Service Cost of Operating Service Facility Cost of Waiting Time Service Level 14-5
Waiting Line Cost AnalysisThree Rivers Shipping Number of Stevedore Teams 1 2 3 4 Avg. number of ships arriving per shift 5 5 5 5 Average waiting time per ship 7 4 3 2 Total ship hours lost 35 20 15 10 Est. cost per hour of idle ship time $1,000 $1,000 $1,000 $1,000 Value of ships' lost time 35,000 29,000 $15,000 $10,000 Stevedore teams salary $6,000 $12,000 18,000 $24,000 Total Expected Cost $41,000 $32,000 $33,000 $34,000 14-6
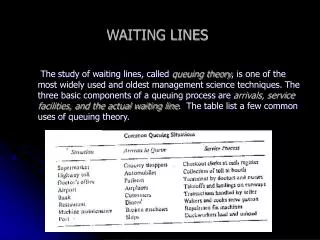
Characteristics of a Waiting Line System • Calling Population • Unlimited • Limited 14-7
Characteristics of a Waiting Line System - cont. • Arrival Characteristics • Arrival rate distribution • Poisson • other • Pattern of arrivals • random • scheduled • Behavior of arrivals • join the queue, and wait till served • balk; refuse to join the line • renege; leave the line 14-8
Characteristics of a Waiting Line System- cont. • Waiting Line Characteristics • Length of the queue • limited • unlimited • Service priority/Queue discipline • FIFO • other 14-9
Characteristics of a Waiting Line System - cont. • Service Facility Characteristics • Number of channels • single • multiple • Number of phases in service system • single • multiple • Service time distribution • negative exponential • other 14-10
Poisson Distribution for Arrival Times P(X), = 2 P(X), = 4 .35 P(X) P(X) .30 .30 .25 .25 .20 .20 .15 .15 .10 .10 .05 .05 .00 .00 0 1 2 3 4 5 6 7 8 9 10 11 0 1 2 3 4 5 6 7 8 9 10 11 X X 14-11
Basic Queuing System Configurations Queue Service facility Single Channel, Single Phase Service Facility Queue Facility 2 Facility 1 Single Channel, Multi-Phase 14-12
Basic Queuing System Configurations Service facility 1 Queue Service facility 2 Service facility 3 Multi-Channel, Single Phase Queue Type 2 Service Facility Type 1 Service Facility Type 1 Service Facility Type 2 Service Facility Multi-Channel, Multiphase Phase 14-13
Exponential Distribution for Service Times Average Service Time of 20 Minutes Probability (for Intervals of 1 Minute) Average Service Time of 1 Hour 30 60 90 120 150 180 X 14-14
Assumptions: M/M/1 Model 1. Queue discipline: FIFO 2. No balking or reneging 3. Independent arrivals; constant rate over time 4. Arrivals: Poisson distributed 5. Service times: negative exponential 6. Average service rate > average arrival rate 14-15
Performance Measures of Queuing Systems • Average time each customer spends in the queue • Average length of the queue • Average time each customer spends in the system • Average number of customers in the system • Probability that the service facility will be idle • Utilization factor for the system • Probability of a specific number of customers in the system 14-16
Equations: M/M/1 14-17
Equations: M/M/m 14-18
Equations: M/D/1 14-19