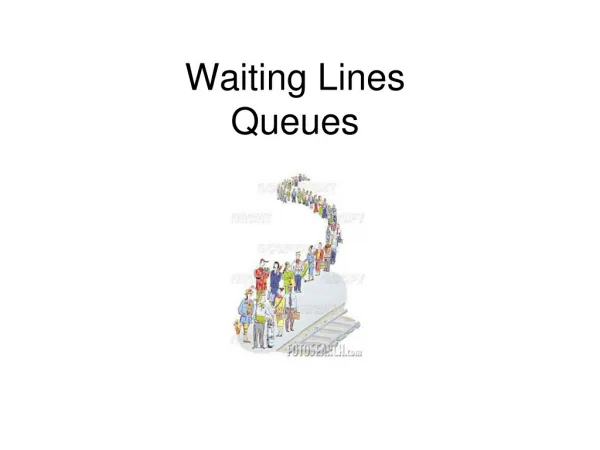

WAITING LINES
E N D
Presentation Transcript
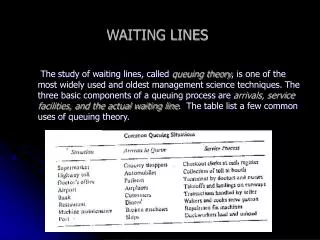
WAITING LINES The study of waiting lines, called queuing theory, is one of the most widely used and oldest management science techniques. The three basic components of a queuing process are arrivals, servicefacilities, and the actual waiting line. The table list a few common uses of queuing theory.
QUEUING COSTS Most queuing problems are centered about the question of finding the ideal level of service that a firm should provide. Supermarkets must decide how many cash-register-checkout positions should be opened. Gasoline stations must decide how many pumps should be opened and how many attendants should be on duty. Manufacturing plants must determine the optimum number of mechanics to have on duty each shift to repair machines that break down. One evaluation criterion is total expected cost, a concept illustrated in fig. 17.1 Total expected cost is the sum of service costs plus waiting costs. Service costs are seen to increase as a firm attempts to raise its level of service.
Example: If three teams of stevedores, instead of two, are employed to unload a cargo ship, service costs are increased by the additional price of wages. As service improves in speed, however, the cost of time spent waiting lines decreases. This waiting cost may reflect lost productivity of workers while their tools or machines are awaiting repairs, or may simply be an estimate of the cost of customers lost because of poor service and long queues.
Queuing theory helps in making decisions that balance service levels with waiting line service costs. Some of the many measures of a waiting-line system’s performance which are commonly obtained in a queuing theory analysis are as follows: • The average time each customer or object spends in the queue. • The average queue length.
3.The average time each customer spends in the system( waiting line + service time) 4. The average number of customers in the system. 5. The probability that the service facility will be idle. 6. The probability of a specific number of customers in the system.
3. Arrivals are described by a Poisson probability distribution and come from an infinite ( or very, very large) population. 4. Service times also vary from one customer to the next and are independent of one another, but their average rate is known. 5. Service times occur according to the negative exponential probability distribution. We let
Example 17.2 Jones, the mechanic at Golden Muffler Shop, is able to install new mufflers at an average rate of 3 per hour (or about one every 20 minutes) according to a negative exponential distribution. Customers seeking this service arrive at the shop on the average of 2 per hour following a Poisson distribution. The customers are served on a first in, first out basis and come from a very large (almost infinite) population of possible buyers. With this description, we are able to obtain the operating characteristics of Golden Muffler’s queuing system.
MULTIPLE-CHANNEL WAITING LINES Multi-channel queuing system, two or more servers or channels are available to handle customers who arrive for service. This system still assumes, however that customers awaiting service form one single line and then proceed to the first available server. An example of such a multiple-channel waiting line is found in many banks today, where a common line is formed and the customer at the head of the line proceeds to the first free teller. The system is illustrated in fig.
The multiple-channel system presented here again assumes that arrivals follow a Poisson probability distribution and that service times are exponentially distributed. Service is “first-come, first-served” and all servers are assumed to perform at the same rate. If we let C equal the number of channels open, then the following formulas may be used in the waiting line analysis. λ = average arrival rate µ = average service rate at each channel. The probability that there are zero people or units in the system:
The average number of people or units in the system The average time a unit spends in the system (namely, the sum of the times spent waiting in line plus being serviced): The average number of people or units in line waiting for service: The average time a person or unit spends in the queue waiting for services: These equations provide the same information as did the simpler model.
EXAMPLE 17.4 The Golden Muffler Shop has decided to open a second garage bay and to hire a second mechanic to handle muffler installations. Customers, who arrive at the rate of about λ = 2 per hour, will wait in a single line until one of the two mechanics is free. Each mechanic installs mufflers at the rate of about µ = 3 per hour. To find out how this change compares to the old single-channel waiting-line system, we shall compute several operating characteristics for the C = 2 channel system and compare the results with those found in example 17.2
We can summarize these characteristics and compare them to those of the single-channel model as follows. The increased service has a dramatic effect on almost all characteristics. In particular, time spent waiting in line drops from 40 minutes to only 21/2 minutes.
Other Queuing Models • The first-in, first-out discipline is not observed, • Arrivals are not Poisson distributed or service times are not exponentially distributed, • Arrivals do not come from an infinite population, and • Servicing involves a multiple-phase operation.