Download
1 / 22
220 likes | 329 Views
Learn how to organize and interpret real-life data using box-and-whisker plots, a graphical representation technique dividing data into four parts. Discover steps to draw these plots and make sense of data distribution.

E N D
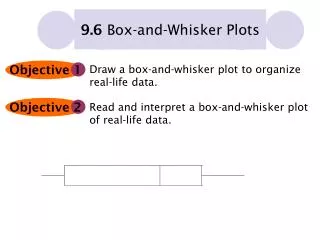
Objective 1 Objective 2 9.6 Box-and-Whisker Plots Draw a box-and-whisker plot to organize real-life data. Read and interpret a box-and-whisker plot of real-life data.
A box-and-whisker plot is a data display that divides a set of data into four parts. • The median or second quartile separates the set into two halves, the numbers that are below the median and the numbers that are above the median. • The first quartile is the median of the lower half. • The third quartile is the median of the upper half. • The “box” extends from the first to the third quartile. • The “whiskers” connect the box to the least and greatest numbers.
Stages in drawing a box plot • Find the quartiles • Find the values of the whiskers • Draw a box plot to scale – on graph paper
Example:Waiting times at a bus were recorded, to the nearest minute, on 10 occasions. The data collected were: 6, 1, 4, 9, 18, 3, 5, 10, 1, 4 (a) Find the quartiles (b) Draw a box-and-whisker plot to represent these data
Example: Waiting times at a bus were recorded, to the nearest minute, on 10 occasions. The data collected were: 6, 1, 4, 9, 18, 3, 5, 10, 1, 4 (a) Find the quartiles (b) Draw a box-and-whisker plot to represent these data
Example: Waiting times at a bus were recorded, to the nearest minute, on 10 occasions. The data collected were: 6, 1, 4, 9, 18, 3, 5, 10, 1, 4 (a) Find the quartiles (b) Draw a box-and-whisker plot to represent these data
Example: Waiting times at a bus were recorded, to the nearest minute, on 10 occasions. The data collected were: 6, 1, 4, 9, 18, 3, 5, 10, 1, 4 (a) Find the quartiles Answer re-order the data:
Example: Waiting times at a bus were recorded, to the nearest minute, on 10 occasions. The data collected were: 6, 1, 4, 9, 18, 3, 5, 10, 1, 4 (a) Find the quartiles Answerre-order the data:
Example: Waiting times at a bus were recorded, to the nearest minute, on 10 occasions. The data collected were: 6, 1, 4, 9, 18, 3, 5, 10, 1, 4 (a) Find the quartiles Answer re-order the data: 1 1 3 4 4 5 6 9 10 18 Q2 The median is the middle value:
Example: Waiting times at a bus were recorded, to the nearest minute, on 10 occasions. The data collected were: 6, 1, 4, 9, 18, 3, 5, 10, 1, 4 (a) Find the quartiles Answer re-order the data: 1 1 3 4 4 5 6 9 10 18 Q2 The median is the middle value: = 4.5 mins The lower quartile, Q1 3rd value
Example: Waiting times at a bus were recorded, to the nearest minute, on 10 occasions. The data collected were: 6, 1, 4, 9, 18, 3, 5, 10, 1, 4 (a) Find the quartiles Answer re-order the data: 1 1 3 4 4 5 6 9 10 18 Q1 Q2 The median is the middle value: = 4.5 mins The lower quartile, Q1 3rd value = 3 mins
Example: Waiting times at a bus were recorded, to the nearest minute, on 10 occasions. The data collected were: 6, 1, 4, 9, 18, 3, 5, 10, 1, 4 (a) Find the quartiles Answer re-order the data: 1 1 3 4 4 5 6 9 10 18 Q1 Q2 The median is the middle value: = 4.5 mins 3 mins The lower quartile, Q1 The upper quartile, Q3 8th value =
Example: Waiting times at a bus were recorded, to the nearest minute, on 10 occasions. The data collected were: 6, 1, 4, 9, 18, 3, 5, 10, 1, 4 (a) Find the quartiles Answer re-order the data: 1 1 3 4 4 5 6 9 10 18 Q1 Q2 Q3 The median is the middle value: = 4.5 mins The lower quartile, Q1 3 mins The upper quartile, Q3 8th value = 9 mins
Example: Waiting times at a bus were recorded, to the nearest minute, on 10 occasions. The data collected were: 6, 1, 4, 9, 18, 3, 5, 10, 1, 4 (a) Find the quartiles Answer re-order the data: 1 1 3 4 4 5 6 9 10 18 Q1 Q2 Q3 The median is the middle value: = 4.5 mins The lower quartile, Q1 3 mins The upper quartile, Q3 9 mins The “box” inter-quartile range = Q3 – Q1 = 9 – 3 = 6 mins
1 1 3 4 4 5 6 9 10 18 Q1 Q2 Q3 0 5 10 15 20 25 Example: Waiting times at a bus were recorded, to the nearest minute, on 10 occasions. The data collected were: 6, 1, 4, 9, 18, 3, 5, 10, 1, 4 (b) Draw a box-and-whisker plot to represent these data Answer: 1 1 3 4 4 5 6 9 10 18 Recall from (a) Q1 = 3, Q2 = 4.5, Q3 = 9 Q1 Q3
1 1 3 4 4 5 6 9 10 18 Q1 Q2 Q3 0 5 10 15 20 25 Example: Waiting times at a bus were recorded, to the nearest minute, on 10 occasions. The data collected were: 6, 1, 4, 9, 18, 3, 5, 10, 1, 4 (b) Draw a box-and-whisker plot to represent these data Answer: 1 1 3 4 4 5 6 9 10 18 Recall from (a) Q1 = 3, Q2 = 4.5, Q3 = 9 Q1 Q3
1 1 3 4 4 5 6 9 10 18 Q1 Q2 Q3 0 5 10 15 20 25 Example: Waiting times at a bus were recorded, to the nearest minute, on 10 occasions. The data collected were: 6, 1, 4, 9, 18, 3, 5, 10, 1, 4 (b) Draw a box-and-whisker plot to represent these data Answer: 1 1 3 4 4 5 6 9 10 18 Recall from (a) Q1 = 3, Q2 = 4.5, Q3 = 9 Q1 Q3
1 1 3 4 4 5 6 9 10 18 Q1 Q2 Q3 0 5 10 15 20 25 Example: Waiting times at a bus were recorded, to the nearest minute, on 10 occasions. The data collected were: 6, 1, 4, 9, 18, 3, 5, 10, 1, 4 (b) Draw a box-and-whisker plot to represent these data Answer: 1 1 3 4 4 5 6 9 10 18 Recall from (a) Q1 = 3, Q2 = 4.5, Q3 = 9 Q1 Q3
1 1 3 4 4 5 6 9 10 18 Q1 Q2 Q3 0 5 10 15 20 25 Example: Waiting times at a bus were recorded, to the nearest minute, on 10 occasions. The data collected were: 6, 1, 4, 9, 18, 3, 5, 10, 1, 4 (b) Draw a box-and-whisker plot to represent these data Answer: 1 1 3 4 4 5 6 9 10 18 Recall from (a) Q1 = 3, Q2 = 4.5, Q3 = 9 Q1 Q3
1 1 3 4 4 5 6 9 10 18 Q1 Q2 Q3 0 5 10 15 20 25 Example: Waiting times at a bus were recorded, to the nearest minute, on 10 occasions. The data collected were: 6, 1, 4, 9, 18, 3, 5, 10, 1, 4 (b) Draw a box-and-whisker plot to represent these data Answer: 1 1 3 4 4 5 6 9 10 18 Recall from (a) Q1 = 3, Q2 = 4.5, Q3 = 9 Q1 Q3
1 1 3 4 4 5 6 9 10 18 Q1 Q2 Q3 0 5 10 15 20 25 Example: Waiting times at a bus were recorded, to the nearest minute, on 10 occasions. The data collected were: 6, 1, 4, 9, 18, 3, 5, 10, 1, 4 (b) Draw a box-and-whisker plot to represent these data Answer: 1 1 3 4 4 5 6 9 10 18 Recall from (a) Q1 = 3, Q2 = 4.5, Q3 = 9 Q1 Q3
0 5 10 15 20 25 Example: Read and interpret a box-and-whisker plot. Bus wait time Using just the box-and-whisker plot, compare the number of people who waited 1 to 3 minutes to the number of people who waited 9 to 18 minutes. Answer: The numbers are about the same because each whisker represents about 25% of the data. How long is the median wait time for the bus? Answer: The median wait time is 4.5 minutes.