Download

1 / 33
330 likes | 435 Views
Learn statistical inference concepts in management with homework assignments. Topics covered include probability, variability, and Central Limit Theorem. Use worksheets and tables to practice and understand statistical concepts effectively.

E N D
Please click in Set your clicker to channel 03 My last name starts with a letter somewhere between A. A – D B. E – L C. M – R D. S – Z
MGMT 276: Statistical Inference in Management Welcome http://www.thedailyshow.com/video/index.jhtml?videoId=188474&title=an-arab-family-man
Please read: Chapters 5 - 9 in Lind book & Chapters 10, 11, 12 & 14 in Plous book: Lind Chapter 5: Survey of Probability Concepts Chapter 6: Discrete Probability Distributions Chapter 7: Continuous Probability Distributions Chapter 8: Sampling Methods and CLT Chapter 9: Estimation and Confidence Interval Plous Chapter 10: The Representativeness Heuristic Chapter 11: The Availability Heuristic Chapter 12: Probability and Risk Chapter 14: The Perception of Randomness We’ll be jumping around some…we will start with chapter 7
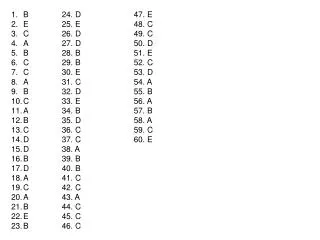
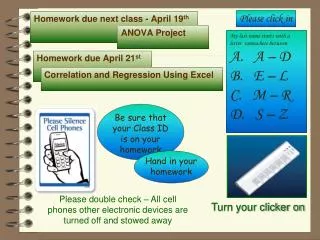
Homework due next class - (Due September 29th) Complete probability worksheet available on class website Please double check – All cell phones other electronic devices are turned off and stowed away
Use this as your study guide By the end of lecture today9/27/11 Measures of variability Standard deviation and Variance Estimating standard deviation Exploring relationship between mean and variability Law of Large NumbersEmpirical, classical and subjective approaches Probability of an event Complement of an event; Union of two events Intersection of two events; Mutually exclusive events Collectively exhaustive events Conditional probability Central Limit Theorem
Homework Worksheet: Problem 1 1 sd 1 sd .68 30 32 28
Homework Worksheet: Problem 2 2 sd 2 sd .95 32 28 34 26 30
Homework Worksheet: Problem 3 3 sd 3 sd .997 24 36 32 28 34 26 30
Homework Worksheet: Problem 4 .50 24 36 32 28 34 26 30
Homework Worksheet: Problem 5 Go to table 33-30 z = 1.5 z = .4332 2 .4332 24 36 32 28 34 26 30
Homework Worksheet: Problem 6 Go to table 33-30 z = 1.5 z = .4332 2 .9332 .4332 .5000 24 36 32 28 34 26 30
77th percentile Go to table nearest z = .74 .2700 x = mean + z σ = 30 + (.74)(2) = 31.48 .7700 .27 .5000 24 36 ? 28 34 26 30 31.48
13th percentile Go to table nearest z = 1.13 .3700 x = mean + z σ = 30 + (-1.13)(2) = 27.74 .37 .50 .13 ? 24 36 32 27.74 34 26 30
Please use the following distribution with a mean of 200 and a standard deviation of 40. Find the area under the curve between scores of 200 and 230. Start by filling in the desired information on curve 20 (to the right)(Note this one will require you to calculate a z-score for a raw score of 230 and use the z-table) Go to table 230-200 z = .75 z = .2734 40 .2734 80 320 240 160 280 120 200
Normal Distribution has a mean of 50 and standard deviation of 4. Determine value below which 95% of observations will occur.Note: sounds like a percentile rank problem 1.64 okay too Go to table .4500 nearest z = 1.65 x = mean + z σ = 50 + (1.65)(4) = 56.60 .9500 .4500 .5000 38 62 54 46 58 ? 42 50 56.60
Normal Distribution has a mean of $2,100 and s.d. of $250. What is the operating cost for the lowest 3% of airplanes.Note: sounds like a percentile rank problem = find score for 3rd percentile Go to table .4700 nearest z = - 1.88 x = mean + z σ = 2100 + (-1.88)(250) = 1,630 .0300 .4700 ? 2100 1,630
Normal Distribution has a mean of 195 and standard deviation of 8.5. Determine value for top 1% of hours listened. Go to table .4900 nearest z = 2.33 x = mean + z σ = 195 + (2.33)(8.5) = 214.805 .4900 .0100 .5000 195 ? 214.8
Try this one: Please find the (2) raw scores that border exactly the middle 95% of the curve Mean of 30 and standard deviation of 2 Go to table .4750 nearest z = 1.96 mean + z σ = 30 + (1.96)(2) = 33.92 Go to table .4750 nearest z = -1.96 mean + z σ = 30 + (-1.96)(2) = 26.08 .9500 .475 .475 26.08 33.92 ? ? 24 32 36 28 30
Variability and means Remember, there is an implied axis measuring frequency f 38 40 44 48 52 56 58 f 40 44 48 52 56
. Writing AssignmentComparing distributions (mean and variability) • Think of examples for these three situations • same mean but different variability • same variability but different means • same mean and same variability (different groups) • estimate standard deviation • calculate variance • for each curve find the raw score for the z’s given
What is probability 1. Empirical probability: relative frequency approach Number of observed outcomes Number of observations Probability of getting into an educational program Number of people they let in 400 66% chance of getting admitted Number of applicants 600 Probability of getting a rotten apple 5% chance of getting a rotten apple Number of rotten apples 5 Number of apples 100
What is probability 1. Empirical probability: relative frequency approach Number of observed outcomes Number of observations Probability of hitting the corvette Number of carts that hit corvette Number of carts rolled 182 = .91 200 91% chance of hitting a corvette
2. Classic probability: a priori probabilities based on logic rather than on data or experience. We assume we know the entire sample space as a collection of equally likely outcomes (deductive rather than inductive). Number of outcomes of specific event Number of all possible events In throwing a die what is the probability of getting a “2” Number of sides with a 2 1 16% chance of getting a two = Number of sides 6 In tossing a coin what is probability of getting a tail 1 Number of sides with a 1 50% chance of getting a tail = 2 Number of sides
3. Subjective probability: based on someone’s personal judgment (often an expert), and often used when empirical and classic approaches are not available. There is a 5% chance that Verizon will merge with Sprint Bob says he is 90% sure he could swim across the river
If P(A) = 0, then the event cannot occur. If P(A) = 1, then the event is certain to occur. The probability of an event is the relative likelihood that the event will occur. The probability of event A [denoted P(A)], must lie within the interval from 0 to 1: 0 <P(A) < 1
Probability The probabilities of all simple events must sum to 1 P(S) = P(E1) + P(E2) + … + P(En) = 1 For example, if the following number of purchases were made by
What is the complement of the probability of an event • The probability of event A = P(A). • The probability of the complement of the event A’ = P(A’) • A’ is called “A prime” • Complement of A just means probability of “not A” • P(A) + P(A’) = 100% • P(A) = 100% - P(A’) • P(A’) = 100% - P(A) Probability of getting a rotten apple 5% chance of “rotten apple” 95% chance of “not rotten apple” 100% chance of rotten or not Probability of getting into an educational program 66% chance of “admitted” 34% chance of “not admitted” 100% chance of admitted or not
Two mutually exclusive characteristics: if the occurrence of any one of them automatically implies the non-occurrence of the remaining characteristic Two events are mutually exclusive if they cannot occur at the same time (i.e. they have no outcomes in common). Two propositions that logically cannot both be true. NoWarranty Warranty For example, a car repair is either covered by the warranty (A) or not (B). http://www.thedailyshow.com/video/index.jhtml?videoId=188474&title=an-arab-family-man
Collectively Exhaustive Events Events are collectively exhaustive if their union isthe entire sample space S. Two mutually exclusive, collectively exhaustive events are dichotomous (or binary) events. For example, a car repair is either covered by the warranty (A) or not (B). NoWarranty Warranty
NoWarranty Satirical take on being “mutually exclusive” Warranty Recently a public figure in the heat of the moment inadvertently made a statement that reflected extreme stereotyping that many would find highly offensive. It is within this context that comical satirists have used the concept of being “mutually exclusive” to have fun with the statement. Decent , family man Arab Transcript: Speaker 1: “He’s an Arab” Speaker 2: “No ma’am, no ma’am. He’s a decent, family man, citizen…” http://www.thedailyshow.com/video/index.jhtml?videoId=188474&title=an-arab-family-man
Thank you! See you next time!!