Download
1 / 12
120 likes | 150 Views
Explore the equilibrium in real output (GDP) and the price level. Learn how shifts in aggregate demand (AD) and aggregate supply (AS) curves impact the economy. Discover the effects of manipulating the AS and AD model on price levels and GDP.

E N D
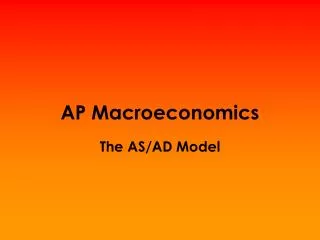
Equilibrium: Real Output (GDP) & the Price Level Unit 3 Part 5 Krugman Section 4 Module 19
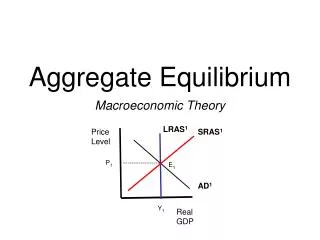
Review • Equilibrium PL and Y are found where the AD and AS curves intersect. • See skeleton graph
Decreases in AD • If AD decreases, recession and cyclical unemployment may result (prices don’t fall easily) • 1. wage contracts are not flexible (or sticky) so businesses cannot afford to reduce prices • 2. employers are reluctant to cut wages because of impact of employee effort • 3. fear of price wars keep prices from being reduced also
Shifting AS • Leftward shift in the curve illustrates cost-push inflation • Rightward shift in curve will cause a decline in price level
Manipulating the AS and AD model • During a long, slow recovery from a recession, consumers postponed major purchases. Suddenly they begin to buy cars, refrigerators and furnaces to replace their failing models.
PL AD will increase as a result of increased consumer spending SRAS PL2 PL1 AD2 AD Y2 Y1 Real GDP
Econoland’s factories have to pay for pollution clean up. SRAS2 SRAS PL PL2 SRAS to the left due to pollution clean up — Input price PL1 AD Y1 Y2 GDP
Because of rising tensions in many developing countries, firms begin to build new factories inEconoland. PL SRAS The increase in investment spending will increase AD. PL2 PL1 AD2 AD Y2 Y1 GDPr
OPEC decided to lower the price of oil. SRAS PL SRAS2 SRAS to the right due to cheaper input prices PL1 PL2 AD Y2 Y1 GDP
With no other dramatic changes, the government raises taxes & reduces transfer payments in the hope of balancing the federal budget. PL Higher taxes and a reduction in transfer payments reduce DI, which reduces consumer spending. SRAS PL1 PL2 AD AD2 Y2 Y1 Real GDP
News of possible future layoffs frightens the public into reducing spending and increasing saving for the feared “rainy day.” A decrease in consumer confidence decreases consumption spending. PL SRAS PL1 PL2 AD AD2 Y2 Y1 GDPr
Brazil solves its foreign debt and inflation problems. It then orders $10 billion worth of capital machinery from Econoland. Draw the AD and SRAS graph for Econoland. PL SRAS Econoland’s exports increase. AD increases. PL2 PL1 AD2 AD Y1 Y2 GDPr