Download
1 / 22
240 likes | 538 Views
Aggregate Supply and the Equilibrium Price Level. CHAPTER OUTLINE. The Aggregate Supply Curve The Equilibrium Price Level The Long-Run Aggregate Supply Curve Monetary and Fiscal Policy Effects Causes of Inflation The Behavior of the Fed. Prepared by:. Fernando & Yvonn Quijano.

E N D
Aggregate Supplyand the EquilibriumPrice Level CHAPTER OUTLINE The Aggregate Supply Curve The Equilibrium Price Level The Long-Run Aggregate Supply Curve Monetary and Fiscal Policy Effects Causes of Inflation The Behavior of the Fed Prepared by: Fernando & Yvonn Quijano
13.1 The Aggregate Supply Curve Aggregate supply The total supply of all goods and services in an economy. Aggregate supply (AS) curve A graph that shows the relationship between the aggregate quantity of output supplied by all firms in an economy and the overall price level. The AS curve is more complex than a simple individual or market supply (SS) curve. The AS curve is nota market supply curve, and it is notthe sum of all the individual supply curves in the economy. It is thus helpful to think of the AS curve as a “price/output response” curve, i.e. a curve that traces out the price decisions and output decisions of all firms in the economy under a given set of circumstances.
Aggregate Supply in the Short Run The shape of the short-run AS curve (the price/output response curve) is a source of much controversy in macroeconomics. The AS curve has a positive slope because when aggregate demand , the response will be an increase in both output (Y) and price (P). Many economists believe that at low levels of aggregate output (firms have excess capacity), the curve is fairly flat (Y>P). As the economy approaches capacity, the curve becomes nearly vertical (P>Y). . At capacity, the curve is vertical (increases in demand will be met by raising prices only). The flat and steep parts of the AS curve are due to the difference in the levels of firms’ capacity utilization.
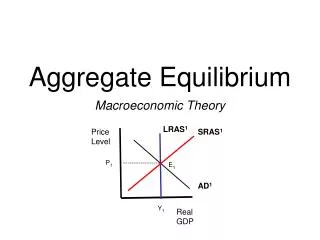
13.2 The Equilibrium Price Level FIGURE 13.3 The Equilibrium Price Level At each point along the AD curve, both the money market and the goods market are in equilibrium. Each point on the AS curve represents the price/ output decisions of all the firms in the economy. P0 and Y0 correspond to equilibrium in the goods market and the money market and to a set of price/output decisions on the part of all the firms in the economy.
13.3 The Long-Run Aggregate Supply Curve FIGURE 13.4 The Long-Run AS Curve When the AD curve shifts from AD0 to AD1, the equilibrium price level initially rises from P0to P1 and output rises from Y0 to Y1. Wages respond in the longer run, shifting the AS curve from AS0 to AS1. If wages fully adjust, output will be back at Y0 and the long-run AS curve is vertical. Y0 is sometimes called potential GDP. If the long-run AS curve is vertical, factors that shift the AD curve to the right (such as Ms, G or T) will end up increasing the price level P only.
13.4 Monetary and Fiscal Policy Effects FIGURE 13.5 A Shift of the Aggregate Demand Curve When the Economy Is on the Nearly Flat Part of the AS Curve An expansionary policy (such as Ms, G or T) shifts the AD curve to the right. A contractionary policy (such as Ms, G or T) shifts the AD curve to the left. If the economy is on the nearly flat portion of the AS curve, an expansionary policy will result in a small price increase relative to the output increase (Y > P). This is when an expansionary policy works well.
FIGURE 13.6 A Shift of the Aggregate Demand Curve When the Economy Is Operating at or Near Maximum Capacity If the economy is on the steep portion of the AS curve, an expansionary policy will result in a much higher price level with little increase in output (P > Y). This is when an expansionary policy does not work well.
If the AS curve is vertical in the long run, neither monetary policy nor fiscal policy has any effect on Y in the long run. It will end up increasing the price level P only. The conclusion that policy has no effect on aggregate output in the long run is perhaps startling. For this reason, the exact length of the long run is one of the most pressing questions in macroeconomics.
13.5 Causes of Inflation (1) Demand-Pull Inflation Inflation that is initiated by an increase in aggregate demand (i.e. by a rightward shift of AD curve).
(2) Cost-Push, or Supply-Side, Inflation Inflation caused by an increase in costs (i.e. by a leftward shift of AS curve). By assuming the government does not react to this shift, the AD curve does not shift. Hence, the price level rises, and output falls (this is called stagflation, i.e. the economy is experiencing both a contraction and inflation simultaneously). What if the government counteract by engaging in an expansionary policy? See next slide Cost-Push, or Supply-Side, Inflation
If the government counteract by engaging in an expansionary policy, the AD curve will shift to the right from AD0 to AD1. This policy would raise aggregate output Y again, but it would raise the price level further, to P2. Either the government intervene or not, cost shocks are bad news for policy makers. FIGURE 13.8 Cost Shocks Are Bad News for Policy Makers
(3) Expectations and Inflation If a firm expects that its competitors will raise their prices, in anticipation, it may raise its own price. If firms increase their prices because of a change in inflationary expectations, the result is a leftward shift of the AS curve. Given the importance of expectations in inflation, the central banks of many countries survey consumers about their expectations. One of the aims of the central banks is to try to keep these expectations low.
(4) Sustained Inflation FIGURE 13.9 Sustained Inflation From an Initial Increase in G and Fed Accommodation An increase in G with the money supply constant shifts the AD curve from AD0 to AD1, and results in a higher price level at P1. A higher price will shift the Md curve to the right, and hence interest rate, which then crowds out I. If the Fed tries to keep the interest rate unchanged (and hence eliminates the crowding out effect) by increasing Ms, the AD curve will shift farther and farther to the right. The result is a sustained inflation (inflation that persists over a long period of time), perhaps even hyperinflation (very rapid increases in the overall price level).
13.6 The Behavior of the Fed In Practice FIGURE 13.10 Fed Behavior
Controlling money supply or the interest rate? When the Fed Ms, the interest rate falls. If the Fed wants to achieve a particular value of the money supply, it must accept whatever interest rate value is implied by this choice. Conversely, if the Fed wants to achieve a particular value of the interest rate, it must accept whatever money supply value is implied by this. For instance, if the Fed wants to lower interest rate by 1% to 5%, it must keep increasing money supply until the interest rate value of 5% is reached. In practice, the Fed controls the interest rate rather than the money supply. And the targeted interest rate depends on the state of the economy.
The State of the Economy and the Fed’s Interest Rate Decision During periods of low output/ low inflation, the economy is on the relatively flat portion of the AS curve. In this case, the Fed is likely to lower the interest rate (by expanding Ms). This will shift the AD curve to the right, from AD0 to AD1, and lead to an increase in output with very little increase in the price level. Y > P For instance, in the U.S., inflation was a concern in early 2008, but lower output was more of a concern. The Fed thus responded by lowering interest rates. FIGURE 13.11 The Fed’s Response to Low Output/Low Inflation
During periods of high output/high inflation, the economy is on the relatively steep portion of the AS curve. In this case, the Fed is likely to increase the interest rate (by contracting Ms). This will shift the AD curve to the left, from AD0 to AD1, and lead to a decrease in the price level with very little decrease in output. P > Y FIGURE 13.12 The Fed’s Response to High Output/High Inflation
How about during periods of stagflation, i.e. the economy is experiencing both a contraction (low output) and inflation simultaneously? If the Fed lowers interest rate, Y will , but so will the inflation rate (which is already too high) Solving output at the expense of inflation. If the Fed increases the interest rate, P will , but so will the output (which is already too low) Solving inflation at the expense of output So, there is a trade-off here, and the decision depends on how the Fed weights output relative to inflation. If Fed dislikes high inflation more than low output, it will increase the interest rate. If Fed dislikes low output more than high inflation, it will lower the interest rate.
Fed Behavior Since 1970 FIGURE 13.13 Output, Inflation, and the Interest Rate 1970 I–2007 IV The Fed generally had high interest rates in the 1970s and early 1980s as it fought inflation. Since 1983, inflation has been low by historical standards, and the Fed focused in this period on trying to smooth fluctuations in output.
Inflation Targeting A monetary authority chooses its interest rate values with the aim of keeping the inflation rate within some specified band over some specified horizon. Some central banks in the world are primarily inflation targeters (for example, the European Central Bank), whereas others are not (for example, the Fed). In the case of inflation targeting, the central banks put all the weight on inflation (and none on output). So, the interest rate decision is aimed at solving inflation problem.