Preparing Quantitative data for analysis
Preparing Quantitative data for analysis. Presented by: Sugandha Lohar. Blind men and an elephant - Indian fable. Things aren’t always what we think!

Preparing Quantitative data for analysis
E N D
Presentation Transcript
Preparing Quantitative data for analysis Presented by: Sugandha Lohar
Blind men and an elephant - Indian fable Things aren’t always what we think! Six blind men go to observe an elephant. One feels the side and thinks the elephant is like a wall. One feels the tusk and thinks the elephant is a like a spear. One touches the squirming trunk and thinks the elephant is like a snake. One feels the knee and thinks the elephant is like a tree. One touches the ear, and thinks the elephant is like a fan. One grasps the tail and thinks it is like a rope. They argue long and loud and though each was partly in the right, all were in the wrong. For a detailed version of this fable see: http://www.wordinfo.info/words/index/info/view_unit/1/?letter=B&spage=3
Exploring and Organizing data • Organizing the data in various ways represents the dynamics within the data. • Fundamental Principle of data exploration : • Where two variables are concerned, one of the variables becomes dominant and governs meaning that emerges from the other. • Whatever the researcher does with the data to prepare it for inspection or interpretation will affect the meaning that the data reveal. Therefore, every researcher should be able to provide a clear, logical rationale for the procedure used to arrange and organize the data.
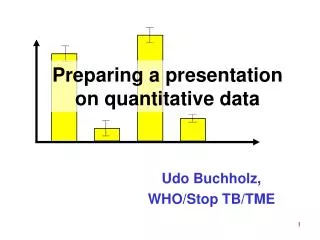
Organize the data to make them easier to think about and interpret • For bigger dataset it is not easy for humans to organize them in one or more ways and inspect. • Graphing dataset is quite useful for revealing pattern in dataset. • Time series studies often yield data that show clear hit-you-between-the-eyes patterns.
Electronic Spreadsheet • A software program that allows a researcherto manipulate data displayed in a table. • Microsoft Excel, Simple Spreadsheet, Spread32, Sphygmic software spreadsheet • Uses - sorting data- searching for desired information- recoding data- graphing from the data- calculating formulas- employing "trial and error" explorations.
Characteristics of statistics • Estimates of population parameters • Different statistics are appropriate for different kind of data. • Considering nature of the data • Single group v/s multi-group data • Continuous v/s discrete variables • Scales of measurement (nominal, ordinal, interval, ratio) • Normal and Non-Normal Distributions • Parametric v/s Non-Parametric Statistics
Analysis • Data Preparation • Descriptive Statistics • Inferential Statistics
Conclusion Validity • Conclusion validity is the degree to which conclusions we reach about relationships in our data are reasonable. • It was originally thought to be a statistical inference issue, it has become more apparent that it is also relevant in qualitative research. • It investigate a relationship, to derive all possible conclusions like there is a relationship in your data or there isn't. • It pertains to causal relationships.
Threats to Conclusion Validity • A threat to conclusion validity is a factor that can leads to reach an incorrect conclusion about a relationship in your observations. • You can essentially make two kinds of errors about relationships: • conclude that there is no relationship when in fact there is (you missed the relationship or didn't see it) • conclude that there is a relationship when in fact there is not (you're seeing things that aren't there!)
Finding no relationship when there is one • low reliability of measures • poor reliability of treatment implementation • random irrelevancies in the setting • random heterogeneity of respondents
Finding a relationship when there is not one • It's important to conduct a thorough analysis, but also if you play with the data long enough, it can often "turn up" results that support or corroborate your hypotheses • This threat to conclusion validity is called fishing and the error rate problem.
Problems that can lead to either conclusion error • Every analysis is based on a variety of assumptions about the nature of the data, the procedures you use to conduct the analysis, and the match between these two. If you are not sensitive to the assumptions behind your analysis you are likely to draw erroneous conclusions about relationships. • In quantitative research this threat is referred as the violated assumptions of statistical tests.
Guidelines for Improving Conclusion Validity • Good Statistical Power • Good Reliability. • Good Implementation
Data Preparation • Logging the data • Checking the data for accuracy • Entering the data into computer • Developing and documenting a database structure
Logging the Data • Data comes from different sources at different time • Standard computerized database program (e.g., Microsoft Access, Claris Filemaker) are used to access data. • Other standard statistical programs (e.g., SPSS, SAS, Minitab, Datadesk) that runs simple descriptive analyses to get reports on data status. • It is also critical that the data analyst retain the original data records for a reasonable period of time -- returned surveys, field notes, test protocols, and so on.
Checking the Data For Accuracy • There are several questions that should be asked as part of this initial data screening: • Are the responses legible/readable? • Are all important questions answered? • Are the responses complete? • Is all relevant contextual information included (e.g., data, time, place, researcher)? • Assuring that the data collection process does not contribute inaccuracies will help assure the overall quality of subsequent analyses.
Developing a Database Structure • In every research project, you should generate a printed codebook that describes the data and indicates where and how it can be accessed. • Minimally the codebook should include the following items for each variable: • variable name • variable description • variable format (number, data, text) • instrument/method of collection • date collected • respondent or group • variable location (in database) • Notes • Together with the database, codebook should provide comprehensive documentation that enables other researchers who might subsequently want to analyze the data to do so without any additional information.
Entering the Data into the Computer • To assure a high level of data accuracy, the analyst uses a procedure called double entry • Another alternative is to enter the data once and set up a procedure for checking the data for accuracy. For instance, analyst might spot check records on a random basis.
Data Transformations • Missing values • Item reversals • Scale totals • Categories