Download
1 / 27
270 likes | 288 Views
This project involves upgrading 28 km of Newell Highway in NSW, known for high heavy vehicle traffic. Investigative services cover 114 test pits, 32 pavement bores, and 12 piezometers, with extensive laboratory testing for subgrade, pavement materials, and structures. Foamed bitumen stabilization is recommended for poor-quality base and subbase materials to increase strength and flexibility, reduce permeability, and withstand adverse weather. While advantageous, the method requires purpose-built equipment and entails higher costs. The project aligns with the successful implementation of foamed bitumen in Cunningham Highway, Queensland, improving pavement design and reliability.

E N D
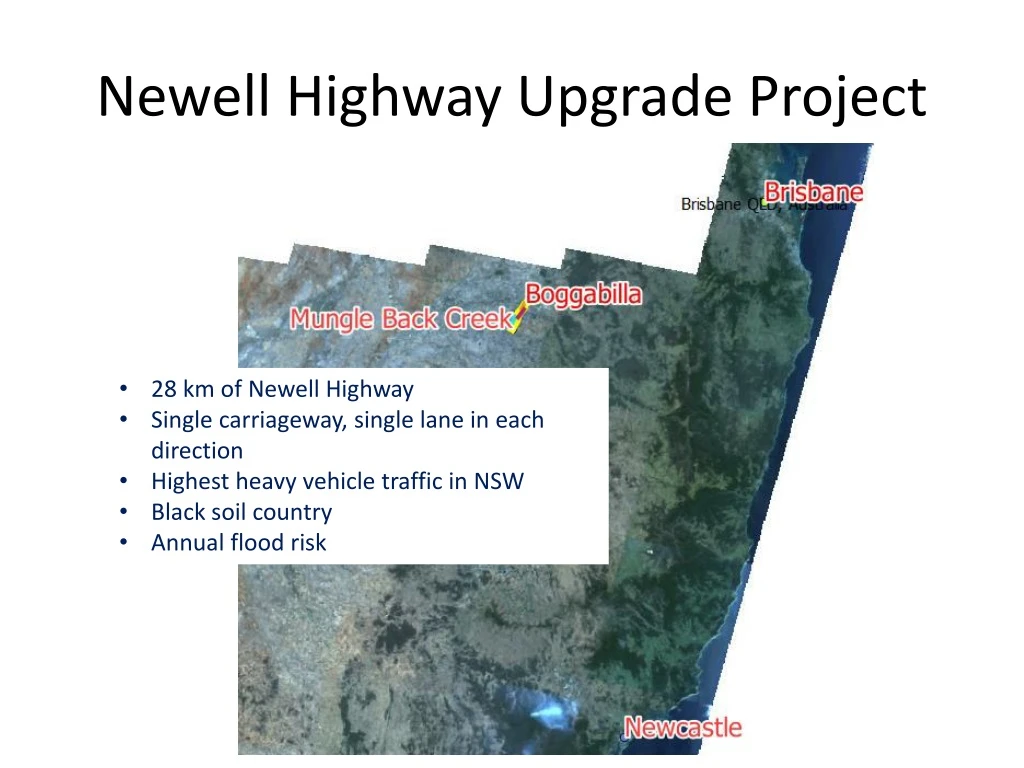
Newell Highway Upgrade Project • 28 km of Newell Highway • Single carriageway, single lane in each direction • Highest heavy vehicle traffic in NSW • Black soil country • Annual flood risk
Scope of Investigation • DP provided: • investigation services; • factual reporting for submission to RMS; and • laboratory testing.
Scope of Investigation • 114 Test pits (shoulder, embankment, verge, offline) • 32 Pavement bores • 12 Piezometers (with monitoring for 16 months)
Scope of Investigation – Laboratory Testing • Subgrade • CBR testing (4 day, 10 day and 21 day soak) – 105 tests; • Atterberg limits – 71 tests; • Particle size distribution including hydrometer – 24 tests; • Emerson – 21 tests • Acid sulfate testing – 50 tests • Pavement Materials • CBR testing (4 day soak) – 16 tests • Atterberg limits – 16 tests • Particle size distribution including hydrometer – 16 tests; • Verge, Cutting and Bridge Sized Structures • CBR testing (10 day soak) – 10 tests; • Atterberg limits – 10 tests • Particle size distribution including hydrometer – 10 tests; • Emerson - 4 tests • Acid sulfate testing – 45 tests • Soil Aggressivity testing – 8 tests
Scope of Investigation – Laboratory Testing • Subgrade • CBR testing (4 day, 10 day and 21 day soak) – 105 tests; • Atterberg limits – 71 tests; • Particle size distribution including hydrometer – 24 tests; • Emerson – 21 tests • Acid sulfate testing – 50 tests • Pavement Materials • CBR testing (4 day soak) – 16 tests • Atterberg limits – 16 tests • Particle size distribution including hydrometer – 16 tests; • Verge, Cutting and Bridge Sized Structures • CBR testing (10 day soak) – 10 tests; • Atterberg limits – 10 tests • Particle size distribution including hydrometer – 10 tests; • Emerson - 4 tests • Acid sulfate testing – 45 tests • Soil Aggressivity testing – 8 tests
Scope of Investigation – Laboratory Testing 130 – 1 per 200 m Predominantly on subgrade Foamed Bitumen Stabilisation of Pavement Subgrade lime stabilisation
Existing Pavement Poor quality base and subase material 40 mm to 50 mm AC CBR = 8% to 45% (8 tests) Clay and silt content = 17% – 23% PI = 4% to 13% 160 mm to 250 mm Base 100 mm to 300 mm Subbase (generally less than 200 mm) CBR = 4.5% to 14% (8 tests) Clay and silt content = 35% – 50% PI = 5% to 17% Shallow subgrade (30 tests) CBR = 1.5% to 12% Clay and silt content = 36% – 93% PI = 18% to 59% Clay and Sandy Clay Subgrade Weak Subgrade Deep Subgrade (20 tests) CBR = 1.5% to 5% Clay and silt content = 56% – 90% PI = 31% to 49%
What is foamed bitumen? It is a mixture of air, water and bitumen The characteristics include: Once a foaming agent is mixed, it expands about 15 times Large surface area and low viscosity When mixed with gravel material, the droplets coat the finer particles that binds them together
What benefits? Bitumen foam stabilised pavement Unbound Pavement Sourced from Wirtgen Group, “Binder with a proven track record worldwide, foamed bitumen” • Increases strength through stabilisation • Modulus increases significantly, shear strength gains (similar to that of cement treated material) but with higher flexibility • Higher flexibility reduces risk of fatigue (cemented material) • Decreases the permeability of the pavement • Less susceptible to heavy rainfall (i.e. copes with weather)
What Disadvantages? • Not suitable for all pavements • Purpose built equipment needed • More expensive than other stabilisation methods
Where has it been done in Aus? • Queensland Main Roads • 1.6 km of Cunningham Highway at Gladfield (near Warwick) • Gympie • Inglewood
Advantages for Pavement Design • The fatigue relationship for asphalt can be used in calculations (CIRCLY), as follows N = RF Where: N= allowable repetitions Smix = Modulus of foamed bitumen stabilised material VB = % by volume of bitumen in the stabilised material RF = reliability factor (=1 for rehabilitation) • This means greater allowable repetitions for the same thickness of pavement layers • RMS puts a cap on Smix of 2500 Mpa (close to some asphalts)
Suitability Assessment • Differs for RMS and QMR • RMS • Binder (RMS R76) • Foamed bitumen expansion ratio of 10 and minimum half life of 20 seconds • Particle distribution as for Material to be bound (RMS 3051) • Plasticity requirements (Austroads PI<10%) – lime can be added to reduce plasticity • Test material with foamed bitumen to obtain average resilient modulus • Plot the average resilient modulus against binder content to determine bitumen application rate require to satisfy table below
Suitability Assessment Blend D meets minimum initial resilient modulus and also minimum soaked resilient modulus Gravel 2.1 and 2.3 do not meet minimum initial resilient modulus
Austroads Design Procedure for Foamed Bitumen • Long Term Modulus (based on laboratory trials) • Initial Modulus (needed because it is assumed that the road will be open within 3 hours of stabilisation) • Adjustments for climate, rate of load
Austroads Design Procedure for Foamed Bitumen • Then the following fatigue relationship is used in calculations (CIRCLY) • greater allowable repetitions for the same thickness of pavement layers • RMS puts a cap on Smix of 2500 Mpa (close to some asphalts)
Austroads Design Procedure for Foamed Bitumen • Minimum Surface Requirements < 1x10⁷ ESA Spray seal or hot mix AC ≥ 1x10⁷ ESA 30 to 40 mm AC (minimum)
Austroads Design Procedure for Foamed Bitumen • Example 5 x 10⁶ ESA Check Uncracked and cracked phase for bound base 300 mm Reconstruction (Austroads Mechanistic) 480 mm thickness (Base and Subbase) 100 mm Existing Road (poorly performing) Proposed Stabilised Road
Newell Highway Proposed Stabilisation • Remove about 300 mm • Lime stabilise remaining subbase and subgrade blend • Re-use top 300 mm with foamed bitumen stabilisation
Foamed Bitumen Stabilisation Process • Normal Stabilisation Process • Run stabilised through the pavement (to stabilisation depth) to mix AC and basecourse • Apply quicklime to the surface • Slake quicklime • Mix the slake lime through the pavement • Shape and lightly compact • Apply foaming agent to hot asphalt in tank and stabilise through pavement
Proposed Newell Highway Stabilisation Process • Excavate to the proposed stabilisation depth • Stockpile material • Stabilise additional 300 mm of existing subbase and subgrade with 8% to 10% lime (LSF + 2%) • Compact the stabilised material • Place stockpiled material on exposed surface • Apply quicklime to the surface • Slake quicklime • Mix the slake lime through the pavement • Shape and lightly compact • Apply foaming agent to hot asphalt in tank and stabilise through pavement
Lime Demand Test Measure the amount of lime to return mix to pH of Lime This is the Lime Saturation Factor – (LSF) Need to add more than the LSF before permanent modification of material occurs
Testing Regime • Two Methods UCS v CBR • CBR testing on subgrade blends • Mixes at LSF, LSF+2, LSF+4 • Aim to get increase in soaked CBR to allow improvement in thickness design and better support for foamed bitumen basecourse • UCS testing of subgrade blends with lime • Trialled different mixes at LSF LSF+2, LSF+4 • Lime, quicklime, hydrated lime • Aim to get UCS of 2.5 MPa @ 28 days
CBR Method Subgrade 3.5% Deep Subgrade 2.5% Pavement Subgrade 3.5% Offline Subgrade 4.0% Overall Subgrade after 110 tests??? 3%