
Spatial and Temporal Distribution of Water Vapour and Liquid Water Path in Murg Valley
This study investigates the integrated water vapour (IWV) and liquid water path (LWP) in the Murg Valley using the HATPRO microwave radiometer. Deployed from April to December 2007, the instrument performed regular elevation and azimuth scans to reveal spatial inhomogeneities in humidity and temperature profiles. Key findings include the variation of IWV up to 20% in low liquid water conditions and the impact of orography on spatial variations. The research aims to enhance understanding of water vapor dynamics through comparative analysis with airborne measurement data.

Spatial and Temporal Distribution of Water Vapour and Liquid Water Path in Murg Valley
E N D
Presentation Transcript
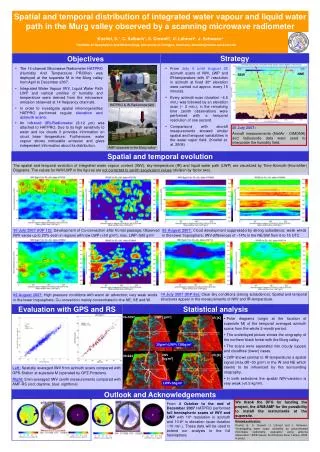
Spatial and temporal distribution of integrated water vapour and liquid water path in the Murg valley observed by a scanning microwave radiometer Kneifel, S.1, C. Selbach1, S. Crewell1, U. Löhnert1, J. Schween1 1 Institute of Geophysics and Meteorology, University of Cologne, Germany, skneifel@meteo.uni-koeln.de Objectives Strategy • The 14-channel Microwave Radiometer HATPRO (Humidity And Temperature PROfiler) was deployed at the supersite M in the Murg valley from April to December 2007. • Integrated Water Vapour IWV, Liquid Water Path LWP and vertical profiles of humidity and temperature were derived from the microwave emission observed at 14 frequency channels. • In order to investigate spatial inhomogeneities HATPRO performed regular elevation and azimuth scans. • From July 6 until August 28 azimuth scans of IWV, LWP and IR-temperature with 5° resolution in azimuth at fixed 30° elevation were carried out approx. every 15 minutes. • Every azimuth scan (duration ~4.5 min.) was followed by an elevation scan (~ 2 min.); in the remaining time zenith observations were performed with a temporal resolution of one second. • Comparisons with aircraft measurements showed similar spatial and temporal variabilities in the water vapor field. (Kneifel et. al. 2008) IR-Radiometer NNE SSW HATPRO & IR-Radiometer(left) • An infrared (IR)-Radiometer (8-12 m) was attached to HATPRO. Due to its high sensitivity to water and ice clouds it provides information on cloud base temperature. Furthermore, water vapour shows noticeable emission and gives independent information about its distribution. 26 July 2007: Aircraft measurements (MetAir - DIMONA) and radiosonde data were used to interpolate the humidity field. AMF-supersite in the Murg valley Spatial and temporal evolution The spatial and temporal evolution of integrated water vapour content (IWV), sky-temperature (IR) and liquid water path (LWP) are visualized by Time-Azimuth-(Hovmöller) Diagrams. The values for IWV/LWP in the figures are not corrected to zenith aequivalent values (division by factor two). 30 July 2007 (IOP 12):Development of Cu-convection after frontal passage; Observed IWV varies up to 20% even in regions with low LWP (<50 g/m²); max. LWP~500 g/m² 05 August 2007: Cloud development suppressed by strong subsidence; weak winds in the lower troposphere; IWV-differences of ~14% in the NE/SW from 6 to 15 UTC 14 July 2007 (IOP 8a):Clear sky conditions (strong subsidence); Spatial and temporal structures appear in the measurements of IWV and IR-temperature. 05 August 2007: High pressure conditions with warm air advection; very weak winds in the lower troposphere; Cu-convection mainly concentrated in the NE, SE and W. Evaluation with GPS and RS Statistical analysis LWP [g/m²] N=1097 IR [K] • Polar diagrams (origin at the location of supersite M) of the temporal averaged azimuth scans from the whole 2-month period. • The underlayed picture shows the orography of the northern black forest with the Murg valley. • The scans were seperated into cloudy (upper) and cloudfree (lower) cases. • LWP shows (similar to IR-temperature) a spatial signal (max.diff~30 g/m²) in the W and NE which seems to be influenced by the surrounding orography. • In both selections the spatial IWV-variation is very weak (<0.5 kg/m²). 30g/m²<LWP<1300g/m² IWV [kg/m²] IR [K] N=224 Left: Spatially averaged IWV from azimuth scans compared with GPS-Station at supersite M (operated by GFZ-Potsdam). Right: 5min-averaged IWV zenith measurements compared with AMF-RS (red: daytime, blue: nighttime) LWP<30g/m² Outlook and Acknowledgements We thank the DFG for funding the project, the ARM/AMF for the possibility to install the instruments at the supersite. From 4 October to the end of December 2007 HATPRO performed full hemispheric scans of IWV and LWP with 10° resolution in azimuth and 10.8° in elevation (scan duration ~10 min.). These data will be used to extend our analysis to the full hemisphere. Related publication: Kneifel, S., S. Crewell, U. Löhnert and J. Schween, “Investigating water vapor variability by ground-based microwave radiometry: evaluation using airborne observation.” IEEE Geosc. And Remote Sens. Letters, 2008, in press.


