Download
1 / 23
230 likes | 352 Views
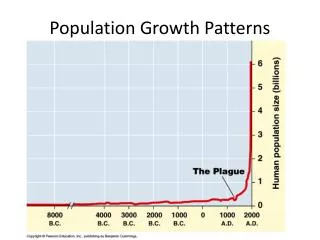
Growth Patterns of Experimental and Clinical Malignancies In Vivo. Folder title: Growth(NoTP). Updated: March 15, 2014. Pre-Clinical Breast Carcinoma (from Gullino, Cancer, 39:2697-2703). 10 3. Questions About Neoplastic Cell Growth. How do we measure neoplastic cell growth?

E N D
Growth Patterns of Experimental and Clinical MalignanciesIn Vivo Folder title: Growth(NoTP) Updated: March 15, 2014
Pre-Clinical Breast Carcinoma(from Gullino, Cancer, 39:2697-2703) 103
Questions About Neoplastic Cell Growth How do we measure neoplastic cell growth? • In Vitro in cell culture or in tissue culture? • In vivo in animals? • In vivo in patients? What are cancer growth patterns like? What causes the patterns of growth that we see? What maintains those growth patterns? Can we alter those patterns to benefit patients?
Measurement of Cancer Growth In Cell Culture • Cell numbers vs time • Colony formation assays • Labelled thymidine incorporation • Dye reduction assays for viable cells(Dye reduction by mitochondrial activity) • Dye exclusion assays by viable cells(Dye exclusion by intact plasma membranes) In Vivo in Experimental Animals • Time to appearance of measurable tumor nodules • Dimensions of tumor nodules with time • Measurement of tumor products (e.g tumor antigens) • Host survival time • (Some guidelines on experimentation with live animal models, survival assays, and compassionate euthanasia)
Human U937 Leukemia Cells Cloned in Soft Agar 200 Cells Cloned Per Tube. Stained with pINT (tetrazolium dye). Cloning Efficiency: 53% 55%
Control of Tumor Growth Rate In Vivo:Cell Production Cell cycle Time Growth Fraction: Proportion of Cells in the Cell Cycle to those in Go (not cycling) Proportion of Clonogenic Stem Cells • Clonogenic Stem Cells • Probability of cell renewal: • 0.5 = No net growth • 1.0 = 100 billion cells after 36 divisions As for bacteria No cell death No cell differentiation • 0.51 = 100 billion cells after 1500 divisions inexorable, slow, relentless growth vs rapid exponential growth implications for therapy
Proliferation Control Differences:Normal Cells vs Neoplastic Cells in Cell Culture Density-dependent Inhibition of Mitosis: (Contact Inhibition of Mitosis) • Normal Fibroblasts: 40,000 cells/cm2 • Virally Transformed Fibroblasts: 4 million cells/cm2 Anchorage-Dependent Effects on Proliferation • Normal Cells Grow Attached and Flattened Stop Dividing When Rounded by Contact Stop Dividing if Artificially Rounded even with no Contact Restart Dividing when monolayer is "wounded" • Transformed Cells Grow Attached and Flattened Keep Growing when rounded by contact (overgrow) Keep growing if artificially rounded even wth no contact Will form colonies in viscous (semi-solid medium)
Control of Tumor Growth Rate In Vivo: Consequences for Concepts of Cancer Treatment Concepts Involving Chemotherapy • Use and limitations of cell-cycle specific agents • Re-seeding of tumor growth by non-cycling cells Concepts Involving Tumor Progression • Cell Loss and Cell Selection • A Microcosm of Evolution Options for In Vivo Therapeutic Control • Anti-angiogenesis • Promotion of apoptosis (programmed cell death) • Exploitation of tumor micro-environment: pH • Tumor necrosis factor • Combination chemotherapy • Cell Synchronization and Cell-cycle-specific treatments • Host response modification • Induction of Differentiation • Targeting the cancer cell phenotype: e.g cell size and cell division
Managing Cancer Development, Progression and Growth In Patients Inhibit Cell Production! Promote Cell Loss!
Control of Tumor Growth Rate In Vivo: Cell Loss Cellular Anaplasia • Disrupted Cytoskeletal Structures • Aberrant Mitoses • Nuclear Abnormalities Positional Anaplasia • Poor Blood Supply; Aberrant Vasculature • Low Oxygen Tension, Acidic pH Host anti-Tumor Responses • Hormonal Effects • Immunological Effects Retained Ability to Respond to Normal Signals Apoptosis: Genetically Programmed Cell Death Retained Recognition of Cell Senescence Programs Applications in Chemotherapy, Radiation Therapy, and Immunotherapy
Control of Tumor Growth Rate In Vivo:Inhibit Aberrant Cell Production Blocking hormone access for hormone-dependent cancers. Induction of differentiation with cytokines or other signals.
Pathological Effects of Canceron the Host Inflammation: Macrophage, Granulocyte Infiltration, Cytokine Production Cachexia (Wasting) Hemorrhaging and Clotting Immunosuppression Infection Pathological Production of Hormones and Other Bio-active Agents Loss of Essential Functions: Tissue Destruction and Vital Organ Failure
Duke University Medical Center Dr. Henry Friedman Glioblastoma and Glioblastoma Multiforme Interveiwed by Dr. Sanjay Gupta 2010 http://www.youtube.com/watch?v=n1Z8yMxSf5E
Preferential Destruction of Leukemia Cells Based on Size: Untreated Human Promyleocytic Leukemia Cells vs Cells Treated with Microfilament-Directed Agent (Cytochalasin B) to Produce Leukemia-specific Cell Enlargement Application of Colony-Formation Assay in Monitoring Effects of Chemotherapy-Physicotherapy Of Leukemia Cells in Cell Culture
Human U937 Leukemia Cells Cloned in Soft Agar 200 Cells Cloned Per Tube. Stained with pINT (tetrazolium dye). Cloning Efficiency: 53% 55%
Untreated U937 cells are reduced in cloning efficiency by less than 20% when sonicated for 4 minutes at 20 watts Seeded 200 Cells
Drug Treated Drug Treated and Sonic Treated Seeded 400 Cells Cloning efficiency of U937 cells treated for 12 hours with 2 uM CB is cut by 60% with sonication for 4 minutes. This compares to 20% reduction in clonogenicity of untreated U937 cells or 40% reduction with drug-treatment alone.
Monitoring Growth in the Therapy of Mammary Carcinomas Lacking BRCA2 Mediated DNA-Repair Capacity
Some Thoughts on Physical Approaches to the Management of Cancers: Leukemias and Blood-borne of Lymphatic Fluid Metastases Application from outside of the patient Precise control of dosage Opportunity for repetitive treatment Whole body application Directed appendage application Application to extra-corporeal shunt Evasion of chemically-based drug resistance (unless combined with chemotherapy to alter size)
Chemotherapy Directed Toward Defective BRCA-1 and BRCA-2 Genes in Breast and Ovarian Cancers (See Figure 12-40 and Sidebar 12.11, p. 520 Weinberg) • Propositions: • Redundant DNA-repair mechanisms needed by both normal and neoplastic cells to repair DNA lesions incurred normally during cell division. • Repair of damaged DNA is even more important if chemotherapy with DNA-directed anticancer agents or radiation therapy is being carried out. • One type of DNA repair involves poly-ADP-ribose polymerase (PARP). • BRCA-1 and BRCA-2 have DNA repair functions as “Housekeeping genes”. • Normal cells can use BRCA-1 and BRCA-2 repair functions as well as PARP repair mechanisms. • Breast and Ovarian cancer cells lacking BRCA-1 and BRCA-2 must rely on the PARP repair option. • What happens if one inhibits the PARP repair function using PARP inhibitors, especially during treatment with agents damaging DNA? Filename: BRCA2Therapy.ppt
Figure 12-40 Weinberg Cells lacking BRCA-2 (red line) are killed off (2 log kill or 99% kill) at 10E-7 M (0.1 uM) anti-PARP drug concentration. (The structure of the inhibitor is not specified). Cells with BRCA-2 repair (blue or green lines) can survive almost 1,000-fold higher concentration of anti-PARP agent (10E-4M or 100 uM) because they can use BRCA-2 for DNA repair.