Download
1 / 23
230 likes | 370 Views
“But Does It Work?” Separating Myth From Truth in the Evaluation of Anti-Poverty Programs: Lessons Learned from the Partnership for Results in New York, including Four Immutable Laws of System Dynamics. Philip B. Uninsky Executive Director Youth Policy Institute (315) 824 0530; (315) 729 6691

E N D
“But Does It Work?” Separating Myth From Truth in the Evaluation of Anti-Poverty Programs:Lessons Learned from the Partnership for Results in New York, includingFour Immutable Laws of System Dynamics Philip B. Uninsky Executive Director Youth Policy Institute (315) 824 0530; (315) 729 6691 uninsky@youthpolicyinstitute.org http://www.YouthPolicyInstitute.org http://www.PartnershipforResults.org
The Partnership’s core innovations for reducing academic underachievement and failure, juvenile violence, and destructive risk-taking: • Implementation of a broad continuum of preventive and early intervention evidence-based programs (EBPs). Their outcomes consistently meet or exceed those predicted by the validating research. • Development of a new form of local governance. It involves public agencies with child-caring responsibilities in an active collaboration to facilitate and sustain an integrated service delivery system comprised, in large part, of preventive and early intervention evidence-based programs
Adverse Childhood Experiences are Common • Household dysfunction • Substance abuse . . . . . . . . . . 27% • Parental sep/divorce . . . . . . . 23% • Mental illness. . . . . . . . . . . . . 17% • Battered mother. . . . . . . . . . . 13% • Criminal behavior. . . . . . . . . . 6% • Abuse • Psychological. . . . . . . . . . . . 11% • Physical . . . . . . . . . . . . . . . . . 28% • Sexual . . . . . . . . . . . . . . . . . . 21% • Neglect • Emotional . . . . . . . . . . . . . . . 15% • Physical . . . . . . . . . . . . . . . . . 10% Source: Edwards, VJ, Anda, RF, Felitti, VJ et al., (2005). The wide-ranging health consequences of adverse childhood experiences. In Kendall-Tackett and Giacomoni (eds.) Victimization of Children and Youth: Patterns of Abuse, Response Strategies, Kingston, NJ: Civic Research Institute.
Adverse Childhood Experiences: Multiple Exposure # of ACE’sPrevalence 0 33% 1 26% 2 16% 3 10% 4 + 16% • Two thirds had at least one Adverse Childhood Experience • 42% had 2 or more Adverse Childhood Experiences
95% of youth in NY’s juvenile detention facilities have 4 or more acute risk factors affecting their social and emotional competence: • Exposure to domestic violence • Mental health service needs (personal &/or familial) • Parent in prison • Abuse or neglect • Substance abuse 86% of all youth released from NY’s juvenile detention facilities are re-arrested within 30 months of release. Source: Frederick, Bruce, (1999) Factors Contributing to Recidivism Among Youth Placed with the New York State Division for Youth. Office of Justice Systems Analysis Research Report. NYS Division of Criminal Justice Services.
Obstacles to successfully implementing cross-agency reforms and the implementation of evidence-based, early intervention programs and services • Agency territoriality reinforced by categorical funding streams that are often linked to specific types of services • Disinclination by public authorities to invest in prevention during times of economic retrenchment • Implementer resistance to change • The inability of service providers to access critical data across agency lines for assessment and treatment • Tendency of evidence-based prevention and early intervention programs to regress to a predictable mean once they have been introduced in a community
Screening devices should be geared toward early onset of behaviors that, if left unaddressed, are likely to result in subsequent service needs
Comprehensive, multi-disciplinary assessments of children to determine: the extent to which they are affected by risk and protective factors as individuals and in families, communities and schools,and • the extent to which they have service needs resulting from emotional disturbance, substance abuse, exposure to violence, and learning disabilities.
Rationale for this form of local governance • Creates a lasting institutional framework for: • Interagency information collection • Resource sharing and substantive collaboration on multi-disciplinary projects • Development of integrated service plans • Accelerates process of identifying and serving children and families most likely to benefit from evidence-based programs and services
Rationale for this form of local governance… • Externalizes the marginal costs of systems reform • Serves as a neutral lever of change • Displaces blame for the difficulties associated with change • Helps agency leadership overcome bureaucratic stasis
Interagency Information Collection • The multi-agency commission is the repository • Information is used for the narrow purposes of assessment and service integration • Adheres to each agency’s legal and procedural requirements
Implementation of interagency management information systems to • Improve the consistency & timeliness of the data • Support a single point of integration • Create a single point of accountability • Permit more effective monitoring of the children & family services system
Elements of an effective implementation of a continuum of care • Rapid and simultaneous implementation; • Reach the populations most eligible to benefit from the programs; • Operate with a high degree of fidelity to the program models and principles; & • Continuous evaluation to ensure that outcomes predicted by research are met or exceeded
From: Single agency focus in policy-making Emphasis on detailed procedural requirements Prescriptive line-item budgeting To: Multi-system planning with more local control Greater reliance on results and outcomes Flexible funding arrangements, tied to performance expectations Implications of this form of local governance
Successful Replication Involves… • Assessing the readiness of public agencies to establish this new form of local governance and to identify (or seek) initial funding to support its efforts. • Redirecting the discourse away from the enumeration of discrete problems and toward the etiology of dysfunctions. • Focusing the attention of decision makers more on program outcomes and less on dosage and treatment effects.
Success Replication Involves… • Identifying evidence-based prevention and early intervention programs (especially those that are outcome based). • Designing sustainability from the outset • Implementing responsive technical assistance, communication of outcomes, cross-agency training, and so on. • Insisting on data-driven decision making and on high levels of fidelity to evidence-based models to avoid the ineluctable regression to the mean.
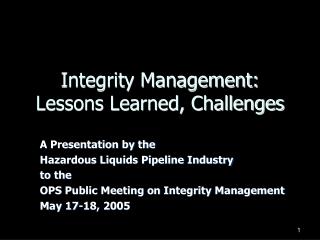
Percentage of Auburn Elementary Students Achieving or Exceeding NYS Learning Standards on the 4th-grade Mathematics Exam (avg. 1998-2001 avg. 2002-07) 80% 81% 81% 81% 77% 77% 79% 75% % of students at or above NYS Learning Standards 74% Casey Park 70% Genesee Street Seward Owasco 65% Herman Ave 63% 60% 61% 55% ! 2002-2007 1998-2001
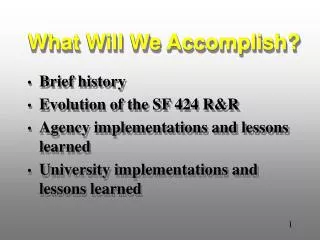
Percentage of Auburn Middle School Students Achieving or Exceeding NYS Learning Standards on the 8th-grade Mathematics Exam (avg. 1998-2001 avg. 2002-07) 60% 63% 59% 55% % of students at or above NYS Learning Standards West MS 50% East MS 47% 45% 45% 40% 35% ! 2002-2007 1998-2001