Download
1 / 24
240 likes | 343 Views
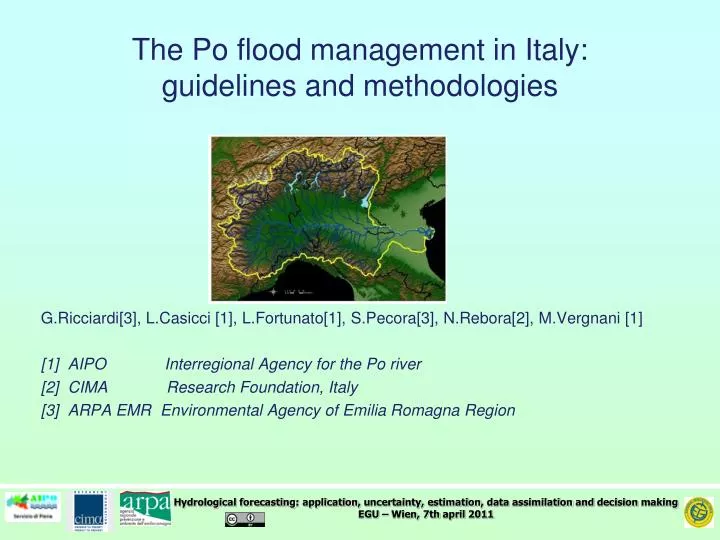
The Po flood management in Italy: guidelines and methodologies. G.Ricciardi [3], L.Casicci [1], L.Fortunato [1], S.Pecora [3], N.Rebora [2], M.Vergnani [1] [1] AIPO Interregional Agency for the Po river [2] CIMA Research Foundation , Italy

E N D
The Po flood management in Italy:guidelines and methodologies G.Ricciardi[3], L.Casicci [1], L.Fortunato[1], S.Pecora[3], N.Rebora[2], M.Vergnani [1] [1] AIPO InterregionalAgencyfor the Po river [2] CIMA ResearchFoundation, Italy [3] ARPA EMR EnvironmentalAgencyof Emilia Romagna Region
Summary Introduction Scheme Example Actual development Further steps
Introduction An operative forecasting and modeling system for hydrological cycle and extreme events is adopted on the Po river It is composed of three modelling chains simulating hy/hy behaviour feeded by observations and forecasting meteorological data A methodology for utilization of system output is needed expecially to compare system capabilities with resources and needs and finally choose the best operational procedures This methodologic scheme is here presented It is based on a State approach. State changes are defined according to observed and predicted values of hydrological parameters and traveling times of river sections Analysis of input/output data and of forecast performances are taken into account
Scheme State changes Flow for each state Details Intersection reality - information
State changes (information layer) Secondaryreaches: Responsetimelessthan 12 h Guidedbydeterministicforecast Forecastedevent on secondaryreaches End of event State 1 (forecast) Guidedbyobservation Forecastedevent on the mainreach State 2 (surveillance ) Notconfirmedevent Guidedbyrun on observation Imminentevent on the mainreach State 3 (monitoring)
Step flow in State 1 (Forecast) • MeteorologicalForecastanalysis • DeterministicHydrologicalForecast (on a reachlist) • Probabilistic HF analysis (onlyifaneventisforecasted) Go on with State 1: no ForecastedEvents Go to State 2: FE on the mainreach Go to State 3: FE on secondaryreaches
Step flow in State 2 (Surveillance) • Deterministic Hydrological forecast • Observed simulation HF ( if an event is forecasted) Go back to State 1: no event is forecasted in Step 1 Go back to Step 1: no event is forecasted in Step 2 Go to State 3:an event is forecasted in Step 2
Step flow in State 3 (Monitoring) • Observed level analysis • Unbiased observed simulation Hydrologic Forecast (no Threshold Exceedings in Step 1) • Deterministic HF (no TE in Step 2) Continuous monitoring: TE in Step 1 Real Time notifications High frequency monitoring: TE in Step 2 and low frequency monitoring is on Low frequency monitoring: TE in Step 3 and monitoring on shortest response time reaches (e.g. 12h) is off Go back to State 1: no more TE in Step 3(end of event)
Details: Meteorological forecast analysis Saturation degree of sub basins (AMC) Forecasted and observed total rainfall on sub basins (LAM runs) (aggregation on RT) Localization of critical reaches (scenarios)
Details: Deterministic Hydrological forecast analysis • HF based on observed precipitation up to T0(now) + forecasted precipitation from T0 to LAM lead time (e.g. 72 hour) • HF based on observed precipitation up to T0 + null precipitation from T0 to hydrological lead time (Observed simulation HF)
23 November 2002 State 1 Hydrologic hydraulic forecast analysis - PIACENZA Probabilistic forecast – COSMO LEPS Deterministic forecast – COSMO I7 Observed simulation forecast Forecast Surveillance Time (hour)
24 November 2002 State 2 Surveillance Surveillance Hydrologic forecast analysis - PIACENZA Probabilistic forecast – COSMO LEPS Deterministic forecast – COSMO I7 Observed simulation forecast Time (hour)
26 November 2002 State 3 Monitoring Monitoring Hydrologic forecast analysis - PIACENZA Probabilistic forecast – COSMO LEPS Deterministic forecast – COSMO I7 Observed simulation forecast Time (hour)
Example - II Piacenza: sample analysis of maximum levels
Example - III Observed Peak water level: 6.14 m Peak discharge: 5.400 mc/s Date of peak: 18/03/2011 5:00 a.m. Time at L1 exceeding: 17/03/2011 4:00 a.m. (+100 hour) Time at L2 exceeding: 17/03/2011 9:00 p.m. (+117 hour) No L3 exceeding Duration of L1 exceeding: 40 h Duration of L2 exceeding: 12 h
Actual development -I Methodology • Layout of information scheme • Analysis and computations • Terminology/simbology • End users • Frequency • Equipments, human resources, activities - User manual
Actual development- II Information import Synoptic - Civil Protection - Regional Centres reports System status checking Updating the system Anomalies Analysis P/Q_WL(hydrologic state), system performances, post processing Briefing Condivision National Civil Protecion, Agency for Po river, Regional Centres Information diffusion Information storing
Actual development- III Procedure, scheme, information and analysis, terminology and symbology, time of emission and the other elements are different for each state They are intended to supply both useful information, with agreed uncertainty, and the best perception of what is occurring, balancing execution times and lead times required by decision makers, reducing missed alarms and false alarms Knowledge and awareness can be increased across the different states giving more and more information and analysis, raising diffusion frequency and giving diffusion advance
Further steps Applications and further developments of the proposed methodology are related to: • additions of modeling components to the operative system • next operational steps (operational procedures, prototype definition and testing, errors recording and corrective actions) In the second phase coordination and information exchange actions will be furthermore focused.
Observed levels (gards) • Rating curve • Hydraulic model • Hydrological model • Observed precipitation • Forecast precipitation