Download
1 / 9
100 likes | 173 Views
As per AEC Report, the estimated average Payback Period for different solar photovoltaic (PV) systems around capital cities to calculate how long they take to pay for themselves.<br>https://www.solar-secure.com.au/blog/payback-periods-for-different-solar-system-sizes/

E N D
PAYBACK PERIODS FOR DIFFERENT SOLAR SYSTEM SIZES info@solar-secure.com.au 1300 867 328
ABOUT SOLAR SECURE Solar Secure was founded with the mission to spread solar across the rooftops of Australia while providing an exceptional customer experience. We have dedicated team of solar experts and professionals across Australia. info@solar-secure.com.au 1300 867 328
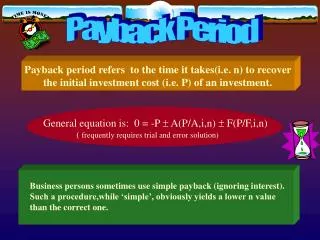
One reason why solar energy is widely being seen as the more viable option for Australian businesses and households is the payback period. The payback period essentially refers to the number of years taken for the total savings to outnumber the total costs of the solar panels, including installation. Total savings translate to the avoided cost of consumption, coupled with revenues received from the feed-in tarif. The total price includes the initial investment along with the time value of money. info@solar-secure.com.au 1300 867 328
A couple of factors determine the payback period of a solar panel system, including its size, cost, ofered feed-in tarif, the prevailing price of retail electricity, and the interest rate on loans. A lot of these determinants are diferent for states across Australia. info@solar-secure.com.au 1300 867 328
The following graph represents the payback period for diferent sizes of solar PV systems across the country. Note that the higher the feed-in tarif ofered by the local retailer, the higher the savings, the shorter the payback period. A comparative study with the previous quarter shows that the price of solar systems has not changed in Darwin and Hobart – the two states with the highest installation costs, and consequently, the highest payback period that exceeds 10 years. Melbourne also marks higher solar system costs than Adelaide, Perth, and Sydney, a discount of $120, $350, and $640 for 3kW, 4kW, and 5kW solar systems. The others have noted a fall in system prices by $40 to $140. info@solar-secure.com.au 1300 867 328
Note that these findings hold true only as long as the discount rate is set at 3.45%. info@solar-secure.com.au 1300 867 328
On the other hand, a graph for the expected payback period for systems with a discount rate of 5.49%. Melbourne has a distinct advantage when installing 5kW systems, as opposed to installing 3kW or 4kW systems. Preferring a 5kW system over the other two in Melbourne can bring down the payback period by three years. As for Adelaide, Perth, Sydney, and Brisbane, the payback period remains constant, even with higher interest rates, as illustrated in the graph below. info@solar-secure.com.au 1300 867 328
info@solar-secure.com.au 1300 867 328
THANK YOU! info@solar-secure.com.au 1300 867 328 Follow Us On: