Download
1 / 32
330 likes | 557 Views
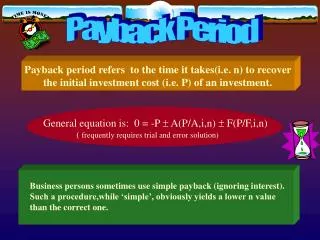
Payback Periods for Photovoltaic Systems. Alex Cronin Associate Professor Physics and Optical Sciences University of Arizona. 1 MW peak PV system. Requires (130 m) 2 = 4.7 Acres of land Up front Annual Payback Cost Benefit period*

E N D
Payback Periods for Photovoltaic Systems Alex Cronin Associate Professor Physics and Optical Sciences University of Arizona
1 MWpeak PV system Requires (130 m)2 = 4.7 Acres of land Up front Annual Payback Cost Benefit period* Money: 5 M$ 0.2 M$ 25 yrs Energy: 7 GWh 1.7 GWh 4 yrs Water: 100 M gallons 15 M gallons 7 yrs * No subsidies, 2009 technology, many variables
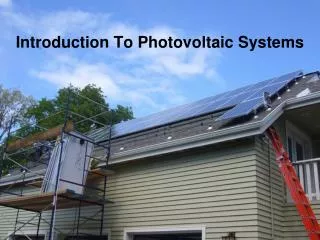
Photovoltaic Panels on Cronin’s House System Cost: $7.50 / Watt
Financial Cost: • PV modules $3 / watt • Mounting + conduit $1 / watt • Inverter $0.5 / watt • Labor + engineering $0.5 / watt ( 30% Federal Tax benefit ) ( 8.5 ¢/kwh for RECs )
PV Cost Reductions Source: Department of Energy ERFC Workshop
Financial Benefit • Electricity generated annually in Tucson: 1750 kwh/yr per kWpeak x 11 ¢/kwh = 193 $/yr / kWpeak (plus 8.5 ¢/kwh in REC money)
PV System Added Nov 2007 85% of my electricity is produced from solar. 13 year payback period at my house after rebates and tax benefits
Power Production Time-series AC Power (kW / m2) Research on: Reliability, Efficiency, Power forecasting Contact: Dr. Alex Cronin, cronin@physics.arizona.edu
Annual Energy Yield • 1.3 x 10¹⁰ J in 2008 • from 14 m2 of c-Si modules. • 300 million more systems • like this (106 km )^2 • could produce 0.4 TW • for 50 years.
Finding: Multiply by 4.8 hrs per day to predict energy yield (year average in Tucson)
4 ½ Years of Daily kWh data www.physics.arizona.edu/~cronin/Solar/TEPweb
TEP PV test yard 4350 E. Irvington Rd.
1 MWpeak PV system Requires (130 m)2 = 4.7 Acres of land Up front Annual Payback Cost Benefit period* Money: 5 M$ 0.2 M$ 25 yrs Energy: 7 GWh 1.7 GWh 4 yrs Water: 100 M gallons 15 M gallons 7 yrs * No subsidies, 2009 technology, many variables
To fabricate a c-Si solar panel takes 400 kWh / m2 Source: DOE/GO-102004-1847 report
1 MWpeak PV system Requires (130 m)2 = 4.7 Acres of land Up front Annual Payback Cost Benefit period* Money: 5 M$ 0.2 M$ 25 yrs Energy: 7 GWh 1.7 GWh 4 yrs Water: 100 M gallons 15 M gallons 7 yrs * No subsidies, 2009 technology, many variables
Water use: • For semiconductor Si, 10 gallons of water / sq-inch • uses HF, HCl, trichlorosilane (SiHCl3), alcohols, catalysts (Cu), heat, clean rooms … Compare to: 1 gallon / kwh evaporated at TEP plus up to 9 gallons / kwh for coal mining and transport … Sources: Scandia National Lab report 1998 “ENVIRONMENTALLY BENIGN SILICON SOLAR CELL MANUFACTURING” http://www.sciencedaily.com/releases/2008/04/080417173953.htm# “Water needed to produce various types of energy”
US Annual Energy Flow (100 Quad BTU = 1020 J = 3x10¹³ kWh) Figure Source:
This is a myth that propagates around the internet. There's an acronym that's used called EROEI, energy returned on energy invested.The myth is that it takes more energy to produce solar panels than the energy they produce from the sunlight.Crystalline silicon PV systems presently have energy pay-back times of 1.5-2 years for South-European locations and 2.7-3.5 years for Middle-European locations. The U.S. is less than 1.5 years currently.The accounting life estimate for solar panels is 20 years typically, but they last longer than that, many are guaranteed for at least 20 years, with no definite end due to time.That's old technology, nothing new here, no inventions, it's been this way for 20 years, I know because I installed solar panels in 1984 and they're still going strong.There are new panels that will improve that number as well as output per size.
One Ton of . . .Steel: 62,000 gallons of waterCement: 1,360 gallons • For an ‘old’ SOLON tracker that holds 40 kw, there are 6 tons of steel and 50 tons of cement. … • 11,000 gal / kw compare to: • 129,000 gal/kw to fab.