Download
1 / 16
160 likes | 304 Views
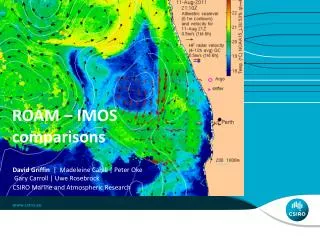
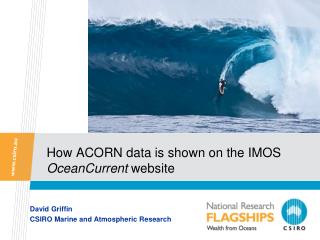
How ACORN data is shown on the IMOS OceanCurrent website. David Griffin CSIRO Marine and Atmospheric Research. Purpose of OceanCurrent. To provide a diverse range of user groups with a quick look at a wide range of data types – not the details of any. A (not exclusive) emphasis on now.

E N D
How ACORN data is shown on the IMOS OceanCurrent website David Griffin CSIRO Marine and Atmospheric Research
Purpose of OceanCurrent • To provide a diverse range of user groups with a quick look at a wide range of data types – not the details of any. • A (not exclusive) emphasis on now. • National coverage. Not tied to any node or facility. • Not interactive. Not a data portal. Just maps and words. • Interpret the data, explain the methods. Integrate the MOS. • Exercise the data system. Identify data mgt inconsistencies. • Eventually: statistical products, not just snapshots and animations
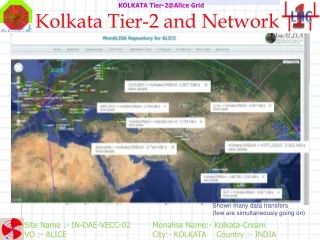
Use of ACORN • Went ‘live’ on 8 June 2012, ie plots update automatically • Showing ROT, SAG, BONC, COF and CBG on top of SST, altimetry, drifters, ANMN and soon: gliders and chlor-a • TURQ is on a secret page because the data look wrong • COF and BONC have lesser problems • CBG is OK but the tides are strong and coverage intermittent • ROT provides the best eye candy – hence the Ocean News item.
Stumbling blocks • Several ‘inconveniences’ (for users) could be removed: • Hourly data stored 1 record per file -> 8 hours to read a year. • Seb has now made monthly files with ~24*30 records –should be much faster to read. • QC flags not useful (and too numerous) • CODAR: • hidden in a folder called ‘Sea state’ – but no wave data. • No TIME dimension. (Time is an attribute, not a variable). • List of points. User must infer the grid. • Many files with no data • Main issue: gappiness. We were warned.
Conclusion • Congratulations to those who have got us to where we are now! • ACORN has a wide range of practical as well as research uses. • Some issues need addressing: • File formats • Calibration • De-tiding. Files could include tidal current predictions, especially for CBG. In turn, analyses of ACORN data will improve those predictions. • Need longer range. Neptune system for GAB/Browse/NWS? • Bluelink will be using ACORN mostly for validation. But Au-focussed projects will assimilate the data into models – and then be hungry mouths.
Thankyou Insert presentation title
Data reading • We use toolsIU.jar (via Matlab’s java virtual machine) for reading the files from the server. FFI: http://www.unidata.ucar.edu/software/netcdf-java/documentation.htm • The harder job is knowing 1) what files are there and 2) what’s in them. • To solve (1) we use Laurent Besnard’s List_NC_recur.m • To solve (2) we simply rummage the metadata with a browser.