Download
1 / 22
230 likes | 418 Views
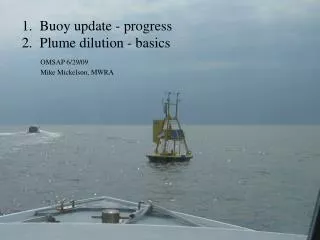
1. Buoy update - progress 2. Plume dilution - basics. OMSAP 6/29/09 Mike Mickelson, MWRA. Data from NOAA NWS NDBC buoy 44013 (The Boston BF buoy) and the GoMOOS A buoy operated by U Maine and also designated as NOAA 44029.

E N D
1. Buoy update - progress2. Plume dilution - basics OMSAP 6/29/09 Mike Mickelson, MWRA
Data from NOAA NWS NDBC buoy 44013 (The Boston BF buoy) and the GoMOOS A buoy operated by U Maine and also designated as NOAA 44029
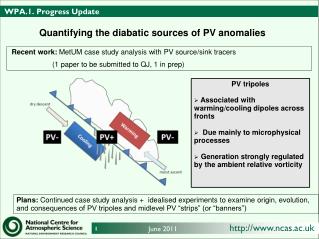
2. Plume dilution - basics: Effluent plume dynamics in relation to outfall monitoring sampling design • Don't sample too close or too far • Within the "initial mixing zone" the plume is too patchy to sample. • Initial mixing occurs within about 10 minutes, and about 60 meters distance from the diffuser. • At that time the plume has diluted to about 100:1 • The plume then becomes more uniform, and dilutes slowly over a few hours. • The plume disperses and breaks up, and is undetectable after a few days, or about 20 km away from the outfall.
Terminology: Mixing Zones Transition: Buoyant spreading Internal jump Near field Far field ocean currents Effluent plume plume rise height Diffuser • Dilution in the near field due to self-induced turbulence. • Dilution in the far field due to horizontal buoyant spreading and ambient turbulence. • Mixing zones: • Regulatory • Hydrodynamic • Zone of initial dilution from Phil Roberts
Near field dilution increases with several factors stronger ocean currents. perpendicular to diffuser axis higher rise of the plume Lower effluent flow per unit length of diffuser
20 m 0 0 90 m Laser imagery of dye in a scale model plume (distance legend is scaled and approximate) "0.010 C/Co" means plume concentration C is 1% of effluent concentration Co, i.e. 100:1 dilution from Phil Roberts
Processes and Scales for Ocean Outfalls Near field Transition Far field Long-term flushing Jet and plume turbulence; internal jumps Buoyant spreading Ambient diffusion Advection by ocean currents Large-scale flushing; upwelling; sedimentation 1 hour 1 day 1 week 1 month 1 10 102 103 104 105 Time scale (min) 1 km 10 km 100 km 10 102 103 104 105 Spatial scale (m) from Phil Roberts
24-Hour trajectories from Brad Butman and Rocky Geyer
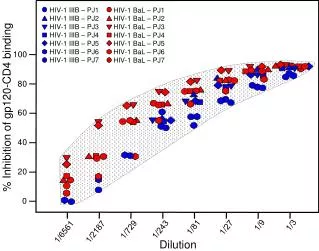
Plume Tracking Survey Dye results • Plume moved to the southeast over 2 day survey • Effluent Dilution of ~1000 in far field
Conclusions • Based on MWRA data, EPA was able to certified that the outfall diffuser effectively dilutes effluent just as it was designed to do. • Measurements closer than about 100m from the diffuser yield noisy data. • Outfall effects are unlikely beyond 20 km from the diffuser. • The plume can travel in any direction due to low-frequency currents driven by wind and river runoff • Residual currents on the scale of weeks also affects circulation • The plume is gone before algal abundance can increase measurably