Download
1 / 1
10 likes | 133 Views
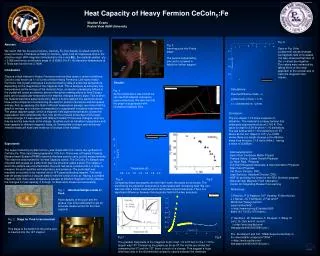
This study investigates the heat capacity and superconducting properties of CeCoIn5:Fe, an iron-doped heavy fermion compound. The effective mass was observed to drop to 0.828 times that of pure CeCoIn5, with a transition temperature of 2.142 K at 0 Tesla. Employing temperature sweeps under varying magnetic fields up to 14 Tesla allowed us to analyze changes in heat capacity and the suppression of superconductivity in response to magnetic field application. The results indicate substantial modifications in the physical properties due to iron doping.

E N D
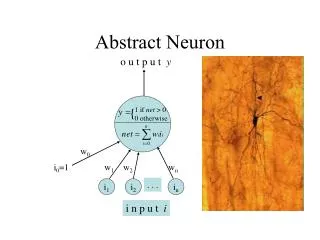
Heat Capacity of Heavy Fermion CeCoIn5:Fe Shalton Evans Prairie View A&M University Abstract: We report that like the pure CeCoIn5, CeCoIn5:Fe (iron doped) is indeed a family of heavy fermions. It behaves similarly to CeCoIn5, apart from its mysterious drop in the effective mass. With magnetic field parallel to the c-axis B||c, the material yielded γ/γ◦ = 0.828 and hence an effective mass of (0.828)9.11e-31. It’s transition temperature at 0 Tesla was found to be 2.142K. Introduction There is a high interest in Heavy Fermions and how they react in certain conditions. CeCoIn5 also known as 1:1:5 is one of those Heavy Fermions. Like many heavy Fermions, this crystal undergoes a superconducting state at some low temperature depending on the magnitude of the magnetic field. This is because at extremely low temperatures as the entropy of the material drops, an electron passing by lattices in the crystal will cause an electron phonon interaction making efforts to form Cooper pairs and at a particular temperature the material changes electric state. This is when the material becomes superconducting. But if a field is applied, the electrons would have some component counteracting the electron phonon interaction and decreases entropy. And, by applying this field in different temperature sweeps, we notice that the graph of entropy as a function of temperature is suppressed in passed experiments. The phase diagram graph, which is magnetic field against temperature, shows this suppression more simplistically. But, how will the physical properties of this heavy fermion change if it were doped with different metals? If there are changes, what are they be and by how much is the change. Qualities such as transition temperature and heat capacity at different magnetic fields, its Sommerfeld constant and its thermal effective mass will have vast evidence of change in the material. Experiment: The superconducting crystal CeCoIn5 was doped with Iron. Hence the synthesis of CeCoIn5:Fe. This crystal was prepared in 10% Iron. There was a Physical Property Measurement System (PPMS) machine that was used to carry out the measurements. This machine was needed for its Heat Capacity option. The CeCoIn5:Fe Sample was mounted with grease on a little thick disc like structure called a puck. The stage on which the sample was mounted within the puck had wires connected to it in order to measure the such qualities as temperature and pressure. The puck itself was mounted on a probe to be inserted into a 16T superconducting magnet. The cavity was de-pressurized to a vacuum state to free the cavity of any air. Having a constant magnetic field, there were temperature sweeps at different magnetic field to observe the changes in heat capacity. 0 through 14 Tesla were measured successfully. Fig. 9 Seen in Fig. 9 the γ(observed) values changes as magnetic field in increased. It is also observed that most of the γ values are negative. The values were extracted by taking the fit of the linear approach to the vertical axis of each the magnetic field values. Fig. 3 Inserting puck into Probe stage. The puck is supported by pins and is screwed in tightly for further support. Results: Calculations: Thermal Effective mass - εF γ(observed)/γ(free) = εF/me εF = γ(observed) me/γ(free) Fig. 4 As the temperature was cooled we can see that material undergoes superconductivity. We also see that the graph is suppressed with increasing magnetic field. Conclusion: The iron doped 1:1:5 show evidence of alteration. The material is a heavy fermion that undergoes superconductivity at 2.142 K. This value is close to 2.3K at which 1:1:5 transitions. The last field at with 1:1:5 transitions is at 5T where as the iron doped is 13T. γ/γ= 0.828 shows there is a drastic change in it’s effective mass from the pure 1:1:5 value (49me). having a value of (0.828)me . Acknowledgments: Kevin Storr Condense Matter Physist Tesfaye Gebre, Crystal Growth Physicist Ju-Hyun Park, Physicist Eric Palm Research Associate & Instrumentation Physicist Stan Tozer Physicist Pat Dixon Director, CIRL Jose Sanchez Assistant Director, CIRL NSF for providing the funds for the REU Summer program National High Magnetic Field Laboratory Center for Integrating Research & Learning. Fig. 5 Fig.6 Comparing these two graphs, we see that in both, the same trend occurs. The trend being the transition temperature is decreases with increasing field. We can also see that a field is reached which terminates superconductivity. There is a significant difference between this magnetic field for the two materials. References: C Petrovic, P G Pagliuso, M F Hundley, R Movshovich, J L Sarrao, J D Thompson, Z Fisk and P Monthoux."Heavy-fermion superconductivity". >>http://www.iop.org/EJ/article/0953-8984/13/17/103/c117l3.html<< V. Guritanu1, W. Goldacker, F. Bouquet, Y. Wang, R. Lortz, G. Goll, and A. Junod1. >>http://arxiv.org/ftp/cond-mat/papers/0403/0403590.pdf<< D.C. Kundaliya† and S.K. "Malik.Superconductivity in the intermetallic compound YRhA." >>http://arxiv.org/ftp/cond-mat/papers/0406/0406109.pdf<< Fig. 1 Mounted Sample inside of Puck Heat capacity of the puck and the grease has to be subtracted to get an accurate measurement for the heat capacity. Fig. 2 Stage for Puck to be mounted on This stage is the bottom of the probe and is inserted into the 16T magnet. Fig.7 Fig.8 The greatest magnitude of the magnetic field in the1:1:5 is 5T but for the 1:1:5:Fe, largest was 13T. Comparing the graphs as far as 0T, the trends are similar but comparing the 5T and the 13T, there is much of a change. This suggest a huge differnece also in the Sommerfeld constant γ values between the materials.