Download
1 / 18
180 likes | 321 Views
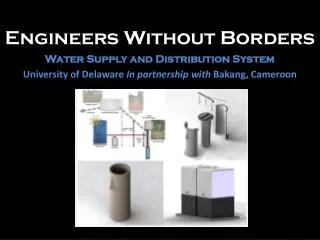
Engineers Without Borders Canada Technical Note on Waterpoint Monitoring Work in Malawi.

E N D
Engineers Without Borders CanadaTechnical Note on Waterpoint Monitoring Work in Malawi This document was prepared to share some of the technical details of our work in Malawi with colleagues in Ghana whose work on G&RI is very similar. Hopefully this will increase cross-program opportunities for feedback and learning. The document is open for distribution to anyone else within EWB who might find it interesting. Please do not distribute outside the organization without first consulting us. To the G&RI folks, we’re looking forward to getting your ideas and insights based on your experience in this area, and hope you might learn something from our work too. Same goes for anyone else reading this.
Acknowledgement This system was developed (and is being implemented) in partnership with WaterAid Malawi, who have provided both technical and financial support. They deserve a large part of the credit for where we are. 2
Background • What is Waterpoint Monitoring? • In the context we’re using it, Waterpoint Monitoring (WPM) means • trying to figure out three things: • Where all the improved waterpoints (e.g. boreholes, protected shallow wells, and taps) in a district are located. • Where the underserved areas are, for use in infrastructure planning. • Where broken waterpoints are located, to help with repairs and rehabilitation.
Background Our History with this Work The team became involved in this work during a major “searching” phase of our program, shortly after the program was split between water supply (aka waterpoint functionality) and hygiene and sanitation behaviour change. In Malawi, a major GPS waterpoint mapping exercise was undertaken between 2004 and 2006. At the cost of about $500,000, every district in the country was mapped. One of the principle players in this was WaterAid Malawi. During the years following the GPS exercise, it became evident that updating the maps and databases was not possible for district government. Partnered with WaterAid, EWB OVS Enam Rabbani set off to design a more appropriate waterpoint monitoring system. His work on this, from February-June, 2009 in Machinga District, became the foundation for this new program area. 4
Getting the Data District HMIS coordinator HSAs Senior HSAs Zone Supervisors District Hospital District Assembly M&E District Water Office From the Field to the Database Data for the system is gathered by government extension workers known as Health Surveillance Assistants (HSAs). There is an HSA assigned to every village in Malawi (theoretically), and these HSAs collect regular quarterly data on all kinds of health indicators. The system in Machinga simply added one more form to their list, for gathering information on water supply. These forms are collected from HSAs through the existing health management information system infrastructure, and then sent to the district M&E office where they are input into an Excel database. 5
Getting the Data Indicators Gathered This is a very minimalist system. The goal was to keep it simple, manageable, and functional. The following key indicators were gathered: Locational Information: Traditional Authority, Group Village, Village. Essentially enough information to go find the waterpoint if you need to. Population Information: The population of the group village where the waterpoint is located, for calculating water access numbers. Type of Waterpoint: Borehole, Shallow Well, or Tap Functionality: Functional or Non-Functional 6
Data Collection Form Data Collection form used by HSAs, too blurry to be really visible. (all of the pictures used are low-res to keep this file small) The form is very simple, and most HSAs have managed to fill it out properly. It was developed through a series of consultations and pilots with the HSAs who are meant to use it.
The Database Blurry picture of the Excel Database. Every row in the database represents a waterpoint (as reported by an HSA). Columns are the indicators discussed in the previous slide, plus a couple of numbers automatically generated from the HSA data (for use in water access calculations).
What we can do with the data Our goal is big results from simple processes. Right now all that the M&E office has to do is input the HSA data line by line. From that, a Pivot Table that can be used for planning is automatically generated. A process to automatically generate maps is also currently under development. For more on the map development process see: http://my.ewb.ca/home/ShowPost/64062 (and also see the following slides) Big ups to EWB’s in-Canada network for basically producing the code overnight. So much latent potential in our network…
Organizing the Data for Planning The blurry image shows a pivot table that is automatically generated when information is input into the database. This pivot table shows water coverage and waterpoint functionality by TA, and is conditionally formatted to make the data as clear as possible. Depending on district needs, the table can be customized to show more/different information.
Organizing the Data for Planning The pivot table can be expanded to show data at the group village level. This is much more useful for planning. For instance, were this image less blurry, you could see that Group Village Ntaja has a population of over 5000, and an 100% functionality rate for their existing water infrastructure, but only 29.7% water coverage. Sounds like a good place for a new borehole.
Converting Data to Maps This is a work in progress, but seems promising. This picture is a map of Machinga Distrtict before pressing the “Water Access by District” button (one of the blurry buttons on the right)
Converting Data to Maps Map of Machinga District after pressing the button. The colours in each TA correspond to the colours on the pivot table. In the future, the goal is to be able to make higher resolution maps, showing data on access and functionality at the group village level.
Using the Map The map and the autoshapes representing the TAs are grouped together as one object in Excel, allowing for easy two-click copy and pasting into reports and proposals.
What You Can Use it For Reports and proposals (everyone likes a little flash) Allocating infrastructure to where it’s most needed, and to where it’s likely to be maintained. (e.g. allocating by need while also rewarding communities with good maintenance records) Planning/supporting repair and rehabilitation of water infrastructure Managing field workers, and holding water monitoring assistants accountable for functionality in their catchment areas More ideas?
Challenges HSA performance – only 80% returned their forms on the first pilot, will it drop even lower in the future? HSAs are not particularly well paid or supervised, and are used to only doing things like this if they get an allowance. Population. When summed, the figures HSAs reported for village population gave a district total 30% higher than the 2008 census. This is likely because some GVHs are in multiple HSAs’ catchment areas, and thus get reported twice. (we’re working on this one). Village/Group Village naming. It’s not clear cut. There are villages, group villages, senior group villages, etc. This will be a major challenge for producing higher resolution mapping. Expense – at about $240 every quarter, data collection isn’t free. (monthly district operational budget for water is about $400-$1000, district dependent.)
Challenges Use and institutionalization. You’re probably familiar with this already. It’s easy to develop the tool, much harder to get people to use it. (we’re kinda doing both simultaneously right now) GPS/GIS. Everyone in Malawi wants to use it, despite over 6 years of consistent failure. Institutionalized use of our system is always under threat of being washed away in a sea of donor allowances tied to some more technically advanced idea. Lack of a unique identification name/number for each waterpoint. This makes it very hard to do detailed comparison of water infrastructure quarter to quarter, and limits you to aggregate numbers by GVH or TA. It also makes it hard to use a “best of both worlds” approach combining regular updating by HSAs with occasional GPS census-style surveys.
Whose Who If you have questions, comments, ideas, or feedback about the system (and we hope you do), please feel free to contact us. Enam Rabbani (08-09 OVS) – System Godfather (aka Original Designer/Implementer) - enamrabbani@ewb.ca Ian Wright (U of A JF, ’09) – Pivot Table Wizard, Implementation Support Expert (from M&E clerk motivation to toner cartridge shaking, and everything in between), - ianwright@ewb.ca Garrett Schmidt (OVS 08-10) – Rogue Implementer sans WaterAid, Master of Budgets and Gantt Charts - garrettschmidt@ewb.ca Edward Ng (Waterloo Chapter Member) – Amazing overnight author of the mapping code, probably also all around good guy. (sorry, don’t have his email yet – see aforementioned myEWB post) Owen Scott (OVS 09-11) – Guy in the corner office. We’re not quite sure what he does – owenscott@ewb.ca