Download
1 / 17
170 likes | 295 Views
This presentation discusses the predictability estimates of tropical cyclone intensity changes using statistical-dynamical models, specifically the SHIPS and LGEM models. It emphasizes recent updates and the effectiveness of these models in improving forecast accuracy, showing track and intensity error reductions over the years. Important findings highlight how improvements in track forecasting can significantly impact intensity predictions. The analysis spans from 1985 to 2009, with a focus on the contributions of various methodologies to enhance prediction capabilities in hurricane forecasting.

E N D
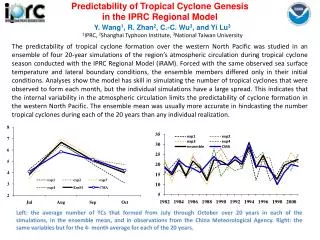
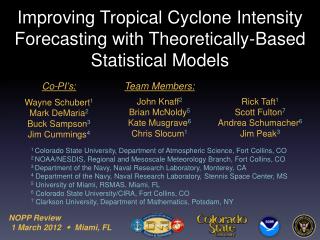
Tropical Cyclone Intensity Change Predictability Estimates Using a Statistical-Dynamical Model Mark DeMaria NOAA/NESDIS/StAR, Fort Collins, CO AMS Tropical Conference Tucson, AZ May 10-14, 2010
Outline • Background information • Charlie Neumann (1987) methodology • Use of statistical-dynamical models for predictability estimates • Recent updates to the SHIPS and LGEM statistical-dynamical intensity models • Predictability results
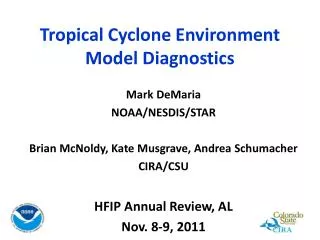
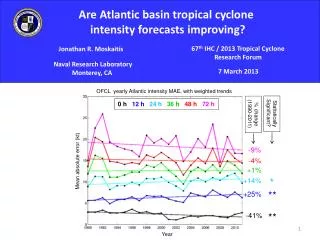
NHC 48 h Atlantic Track and Intensity Errors 1985-2009 Track 63% Improvement in 24 yr Intensity 9% Improvement in 24 yr HFIP Goals: 20% in 5 yr, 50% in 10 yr
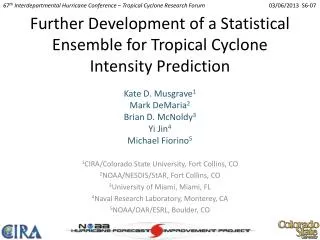
Operational Intensity Forecast Models 2007-2009 Intensity Errors • GFDL (95) and HWRF (07) • 3-D coupled ocean atmosphere models • SHIPS (91) and LGEM (06) • Statistical-dynamical models
C. J. Neumann (1987)Prediction of Tropical Cyclone Motion: Some Practical Aspects • Most accuratetrack models were statistical-dynamical • Track error improvement ~0.5% per year • Error reductions leveling off • How much can track forecasts be improved? • Run NHC83 statistical-dynamical model with “perfect prog” input and compare runs with operational input • Showed 50% improvements were possible
Intensity Predictability Study • Use LGEM statistical-dynamical model • Run 4 versions • V1. NHC forecast tracks, GFS forecast fields • Operational input • V2. NHC forecast tracks, GFS analysis fields • V3. Best track positions, GFS forecast fields • V4. Best track position, GFS analysis fields • V1. Provides current baseline • V4. Provides predictability limit • V2. Evaluates impact of large-scale improvement • V3. Evaluates impact of track improvement
The Logistic Growth Equation Model • Uses analogy with population growth modeling • dV/dt = V - (V/Vmpi)nV • (A) (B) (C) • (A) = time change of maximum winds • Analogous to population change • (B) = growth rate term • analogous to reproduction rate • (C) = Limits max intensity to upper bound • Analogous to food supply limit (carrying capacity) • , n = empirical constants • Vmpi= maximum potential intensity (from empirical SST function) • = growth rate (estimated empirically from ocean, atmospheric predictors GFS,satellite data, etc)
Forecast Procedures • Use 2010 version of LGEM fitted to 1982-2009 developmental sample • Predictability analysis for Atlantic 2002-2009 sample • 135 tropical cyclones • 2402 forecasts to at least 12 h • 859 forecasts to 120 h • Compare LGEM with operational input to combinations of “perfect prog” track and GFS • Forecast verification using standard NHC rules
New LGEM (and SHIPS) Input • Generalized Shear (GS) P2 GS = 4/(P2-P1)∫ [(u-ub)2 + (v-vb)2]1/2 dP P1 P1=1000 hPa, P2=100 hPa, ub,vb = mean u,v in layer • 850-200 hPashear direction parameter • NE shear in low-lat, SW shear in high-lat less detrimental for intensification
Regions with Most Favorable Shear Directions for Hurricane Ike
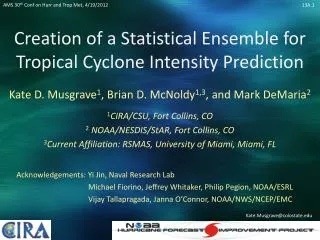
2002-2009 Intensity Errors OFCL = NHC operational forecasts Ver 1 = LGEM w\ oper input Ver 2 = LGEM w\ perfect GFS Ver 3 = LGEM w\ perfect tracks Ver 4 = LGEM w\ perfect tracks + GFS
LGEM Improvements over LGEM w\ Operational Input Perfect GFS Perfect track Perfect GFS & track
Illustration of Track Error1000 plausible Hurricane Ike tracks/intensities based on recent NHC forecast errors
Additional Improvements • TPW , Lightning density, µ-wave imagery input • Knaff et al., Velden et al., this conference • Adjoint of LGEM to include storm intensity history up to forecast time • Consensus/ensembles • Dynamical model improvements under HFIP
2-hourly Composite Lightning StrikesHurricane Ida 8 November 2009
Conclusions • Current intensity forecast properties similar to those for track in 1980s • Neumann (1987) track predictability framework applied to intensity problem • LGEM statistical-dynamical model run with “perfect prog” input • 4%, 8%, 17%, 28%, 36% improvement at 1-5 day • About ½ might be realizable • Majority of intensity improvement from reducing track errors