Download
1 / 9
90 likes | 350 Views
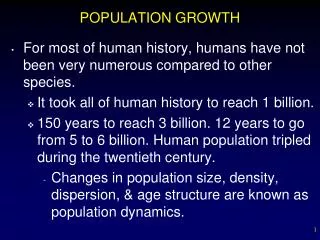
This article explores the different types of population growth as represented through histograms, including negative, positive, and zero population growth. It highlights the characteristics of each growth type, such as fertility rates and economic conditions, particularly in developing versus developed countries. The concept of exponential and logistic growth is discussed, along with factors that limit population size, including density-dependent and independent factors. By visualizing these trends, we gain insight into the shifts in population demographics and their potential future implications.

E N D
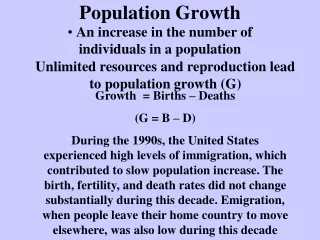
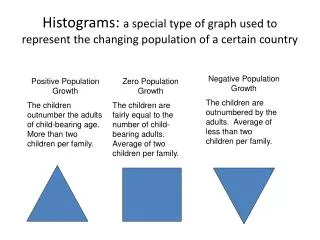
Histograms: a special type of graph used to represent the changing population of a certain country Negative Population Growth The children are outnumbered by the adults. Average of less than two children per family. Positive Population Growth The children outnumber the adults of child-bearing age. More than two children per family. Zero Population Growth The children are fairly equal to the number of child-bearing adults. Average of two children per family.
Histograms: Positive Growth • Developing countries usually show positive growth. • The aged make up a very small population. • Health care may be inaccessible to many, or may be of poor quality. • Economy may not be stable. • Most of population lives at poverty level. • War may be a factor that affects young adult male population
Histograms: Zero Growth • The population is relatively stable, neither growing nor shrinking. • Developed countries with good health care. • Good sized elderly population. • Stable economy with most families being middle class.
Histograms: Negative Growth • Population will experience decrease in near future due to fewer children being born. • Well developed countries. • Larger elderly population • Typically “rich” country. • Future may be economically iffy – aging population relies on government health and pension programs that are supported by taxes of working people.
Histograms Affected by 3 things: • Number of births • Number of deaths • Number of individuals that enter or leave a population.
GROWTH CURVES • By looking at the growth of a population over time, how does it occur?
Exponential Growth Exponential growth ~ Occurs when individuals in a population reproduce at a constant rate. • Occurs when there are unlimited resources. • Graph shows a J-shaped curve. • This occurs until a limit on a resource is reached
Logistic Growth Logistic Growth~ Occurs when a population slows its growth after a period of exponential growth. • Occurs when a limiting factor is introduced. • Graph shows an S-shaped curve. • Carrying capacity ~ • The maximum number of individuals in a population that can be supported by an ecosystem.
Limiting Factors: Anything that limits the size of a population • Density dependent limiting factors ~ A factor that depends on population size. • Disease • Parasites • Predators • Competition • Density independent limiting factors ~ Any large-scale factor that can affect a population that doesn’t depend on the population size. • Natural disaster (Earthquake, flood, tornado, etc.) • Long term change in weather