Download
1 / 34
340 likes | 611 Views
Population Growth. December 7, 2010 Text p . 660-669. Population Dynamics. Populations always changing in size Deaths, births Main determinants (measured per unit time): Natality = number of births Mortality = number of deaths Emigration = # of individuals that move away

E N D
Population Growth December 7, 2010 Text p. 660-669
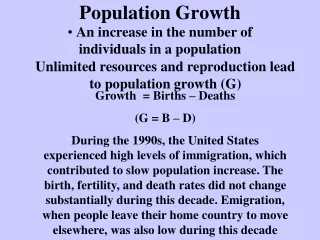
Population Dynamics • Populations always changing in size • Deaths, births • Main determinants (measured per unit time): • Natality = number of births • Mortality = number of deaths • Emigration = # of individuals that move away • Immigration = # of individuals that move into an existing population
Effect on Determinants • The determinants vary from species to species • Environmental Conditions • Fecundity • Potential for a species to produce offspring in one lifetime vs.
Limits on Fecundity • Fertility often less than fecundity • Food availability • Mating success • Disease • Human factors • Immigration/Emigration
Survivorship • 3 patterns in survivorship of species • Type I • Low mortality rates until past reproductive years • Long life expectancy • Slow to reach sexual maturity, produce small numbers of offspring
Type II • Uniform risk of mortality throughout life
Type III • High mortality rates when they are young • Those that reach sexual maturity have reduced mortality rates
Calculating Changes in Population Size Population Change = [(birth + immigration) – (deaths + emigration)] x 100 (%) initial population size (n) • Can be used to calculate growth rate of a population in a give time period • Positive Growth: Birth + Immigration > Death + Emigration • Negative Growth: Birth + Immigration <Death + Emigration
Open/Closed Population • Growth can depend on type of population • Open: influenced by natality, mortality and migration • Closed: determined by natality and mortality alone
Biotic Potential • The maximum rate a population can increase under ideal conditions • Or intrinsic rate of natural increase • Represented as r
Carrying Capacity • Maximum number of organisms sustained by available resources • Represented as k
Population Growth Models • Basic model • No inherent limit to growth Hypothetical model
Geometric Growth Model • In humans, growth is continuous (deaths and births all times of year) • In other organisms deaths may be year round, but births may be restricted • Population typically grows rapidly during breeding season only • Growth rate is constant at fixed intervals of time (breeding seasons)
Geometric Growth Model λ = the geometric growth rate N = population size t = time N (t + 1) = population size in year X λ = N (t + 1) or N(t + 1) = N(t) λ N (t) So... N(t) = N(0) λt
Initial population of 2000 harp seals, gives birth to 950 pups, and during next 12 months 150 die Assuming geometric growth, what is the population in 2 years? Year 1, Population Change = 950 births – 150 deaths = 800 Initial Population N(0) = 2000 Population at end of Year 1, N(1) = 2000 + 950 – 150 Geometric Growth Rate (λ) = 2800 = 1.4 2000 Year 2 (t = 2): N(t) = N(0) λt N(2) = (2000) (1.4)2 = 3920
Exponential Growth Model • Populations growing continuously at a fixed rate in a fixed time interval • The chosen time interval is not restricted to a particular reproductive cycle • Can determine the instantaneous growth rate, which is the intrinsic (per capita) growth rate
Intrinsic growth rate (r) N = population size dN = instantaneous growth rate of population dt Population Growth Rate: dN = rN dt Population’s Doubling time (td) = 0.69 r
2500 yeast cells growing exponentially. Intrinsic growth rate (r) is 0.030 per hour Initial instantaneous growth rate: dN = rN dt = 0.030 x 2500 = 75 per hour Amount of time for population to double in size: Td = 0.69 = 0.69 = 23 hrs r 0.030
Population size after each of 4 doubling times: Td = 23 hrs, initial population = 2500
Curve Shapes Exponential = J-shaped curve Smooth vs. geometric, which fluctuates
Logistic Growth Model • Geometric and exponential assume population will grow at same rate indefinitely • This means intrinsic growth rate (r) is a maximum (rmax) • In reality, resources become limited over time • Population nears the ecosystem’s carrying capacity, and growth rate drops below rmax
Logistic Growth Model • Growth levels off as size of population approaches its carrying capacity Instantaneous growth rate: rmax: maximum intrinsic growth rate N: population size at any given time K: carrying capacity of the environment
Logistic Growth Curve • S-shaped curve (sigmoidal) • 3 phases • Lag, Log, Stationary • At stationary phase, population is in dynamic equilibrium
Useful model for predictions • Fits few natural populations perfectly
r & K Selection • Species can be characterized by their relative importance of r and K in their life cycle
r-Selected Species Carrying capacity, K • Rarely reach K • High biotic potential • Early growth • Rapid development • Fast population growth Population numbers (N) r-selected species Time
K-Selected Species Carrying capacity, K • Exist near K most of the time • Competition for resources important • Fewer offspring • Longer lives K-selected species Population numbers (N) Time
Work: Text Page 669, # 1-5