Download
1 / 17
170 likes | 382 Views
Tip-enhanced Raman spectroscopy of single RNA strands. Elena Bailo and Volker Deckert ISAS – Institute for Analytical Sciences Dortmund, Germany. Poltersdorf, 03-05.10.2007. Motivation. Direct and label-free sequencing of single DNA strand

E N D
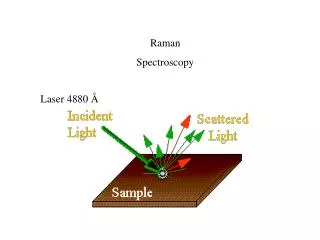
Tip-enhanced Raman spectroscopy of single RNA strands Elena Bailo and Volker Deckert ISAS – Institute for Analytical Sciences Dortmund, Germany Poltersdorf, 03-05.10.2007
Motivation • Direct and label-free sequencing of single DNA strand • Characterization of the structure and dynamic of cell walls U. Neugebauer et al.ChemPhysChem 2007, 8, 124. C. Budich et al. J. Microsc. 2007, (accepted)
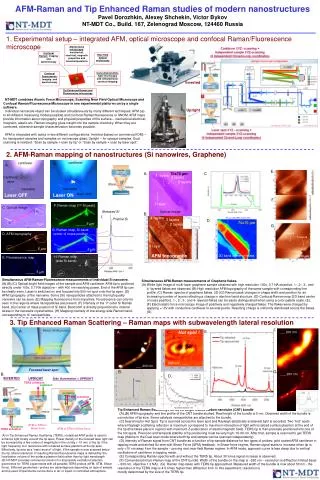
TERS setup AFM Bottom illumination configuration Coarse xy sample stage Coarse xy AFM-positioning IF Laser NF Piezo xy sample stage Spectrometer & CDD Piezo z-focusing A. Rasmussen, V. Deckert, J. Raman Spectrosc. 2006, 37, 311.
TERS tips preparation Si AFM tip Ag Thermal source Diameter ~20 nm Low Rate ~ 0.05 nm/s
High NA objective enable to Direct reflected image Tip and laser alignment X PD
Sample: Synthetic RNA homopolymer on mica Topographical Image
Single RNA strand AFM image Profile
TERS experiment 15s,1mW, @ 530 nm E. Bailo and V. Deckert, Angew. Chem. Int. Ed., 2007, accepted.
C C C C C C C C C C C C C Enhancement factor Laser spot ~ 1 µm Signal-to-noise ratio200:1 ~ 3000 bases x Ag Tip Radius ~ 20 nm 50 Fold 104 ~ 60 bases Enhancement factor at least
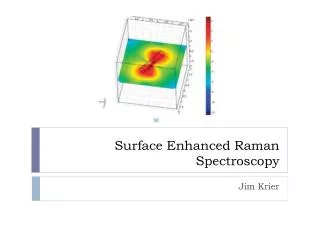
Ag Particle Spectral fluctuations
Band fluctuations:adenine-silver complexes SERS TERS Adenine Predicted Raman spectra: Vibrational frequencies and Raman intensities change for each isomer Ad-N1 Ad-N3 Ad-N7 Ad-N10 H. Watanabe et al., Phys. Rev. B 2004, 69, 155418.
Band identification J. Florian et al. J. Phys. Chem. 1996, 100, 5578.
TERS and DNA sequencing Ag particle
Summary and Outlook • Single RNA strands detection • Approx. 60 nucleobases • SNR ~ 200 • Next step • Natural DNA or RNA sequencing
Acknowledgement • Volker Deckert • Christian Budich, Marc Richter • H. Herzog, E. Pulvermacher, B. Gosciniak
Tip shape TIP Sample