Non-Linear Relationships
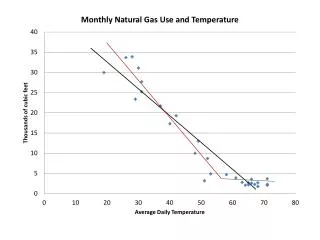
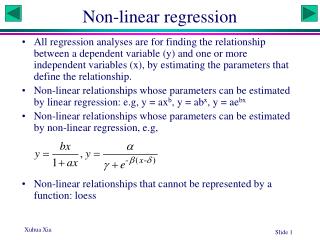
Non-Linear Relationships. If a relationship is not linear, how can we deal with it. For example:. Non-Linear Relationships. One possibility is to take the natural logarithm of both sides. The natural logarithm is the inverse of the natural exponential function. Natural exponent:.

Non-Linear Relationships
E N D
Presentation Transcript
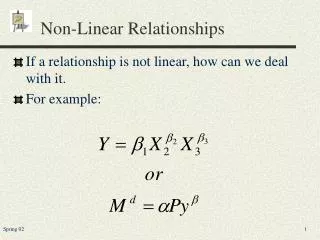
Non-Linear Relationships • If a relationship is not linear, how can we deal with it. • For example:
Non-Linear Relationships • One possibility is to take the natural logarithm of both sides. • The natural logarithm is the inverse of the natural exponential function. • Natural exponent:
Non-Linear Relationships • Natural logs and exponential functions: • e0 =1 • ln 1 = 0 • Logarithms have certain properties: • ln (XY) = ln X+ ln Y • ln(X/Y) = ln X – ln Y • ln(1/X) = ln 1 – ln X = - ln X • ln ax = x lnA
Elasticities • When you take the natural logs of a non-linear relationship and estimate the equation, the estimated coefficients are also the elasticities.
Dummy Variables • Used to quantify qualitative differences. • For example, • Consumption as a function of income may be affected by wartime/peacetime • Income as a function of education may be affected by gender • Quantity demanded of ice cream as a function of price may be affected by season.
Dummy Variables Cp Cp Cp C C C Cw Cw Cw Yd Yd Yd • How does consumption differ in wartime from peacetime?
Example • Salvatore: Below is the quantity supplied of milk by a dairy for 14 months but for 3 of those months there was a strike
Example (1.05) (0.76) (-3.26) (13.9) (-21.2) • If we estimate quantity supplied as a function of price without taking into consideration strike, then we would get these results: • If we estimate quantity supplied as a function of price taking into consideration strike (just affecting the constant), then we would get these results: • If strike: • If no strike:
Example • If we estimate quantity supplied as a function of price taking into consideration strike (just affecting slope), then we would get these results: • If strike: • If no strike: • If we estimate quantity supplied as a function of price taking into consideration strike (affecting both the constant and slope), then we would get these results: • If strike: • If no strike:
Wald Test Revisited At least one of the above betas is not zero.
Example • We can test whether the explanatory variables including strike as a set are significant in explaining price by using a Wald Test:
Test for Structural Change • Data 7-19 contains data from 1960-1988 on the demand for cigarettes in Turkey and its determinants. Estimate the whole equation and also estimate whether two anti-smoking campaigns had their desired effect. • In late 1981, health warning were issued in Turkey regarding the hazards of cigarette smoking. • In 1986, one of the national newspapers launched an antismoking campaign.
Smoking Problem On levels On natural logs
Smoking Problem Regression with dummy variables affecting constant for after 1982 and 1986:
Smoking Problem Regression with dummy variables affecting constant and slope for after 1982 and 1986:
Smoking Problem Regression with dummy variables affecting just the slope for after 1982 and 1986:
Coefficients of Different Regressions • To test whether the assumptions of two different regressions is correct, we start with the null hypothesis that the regressions are identical and see whether or not we can reject the null hypothesis. • Test whether the stock market has changed the relationship between consumption and wealth. • Test whether the relationship between years of education and income is different for women and men or for different regions of the country.
Coefficients of Different Regressions To test the null hypothesis: Run a regression on the whole model, N+M observations. Then run two separate regressions.