Download
1 / 16
160 likes | 267 Views
Grade Distribution and Its Impact on CIS Faculty Evaluations. 1992-2002. David McDonald, Ph.D. davemcdonald@gsu.edu Roy D. Johnson, Ph.D. rjohnson@gsu.edu Georgia State University Computer Information Systems Dept. Atlanta, GA. ( http://www2.cis.gsu.edu/dmcdonald/ISECON2003.ppt ).

E N D
Grade Distribution and Its Impact on CIS Faculty Evaluations 1992-2002 David McDonald, Ph.D. davemcdonald@gsu.edu Roy D. Johnson, Ph.D. rjohnson@gsu.edu Georgia State University Computer Information Systems Dept. Atlanta, GA. (http://www2.cis.gsu.edu/dmcdonald/ISECON2003.ppt)
Introduction • Over half of Harvard undergraduates receive “A”s • 91% graduate with honors • Compared with Yale (51%) and Princeton (44%), one might conclude grade inflation exists at one of the nation’s top institutions (Healy 2001)
Review of the Literature • Most research to date is broad in scope done by the educational discipline • Ample evidence that grade inflation exists in higher education (Nagle 1998; Carey 1993; Young 1993; Carey & Fiedler 1995) • Students also manipulate faculty behaviors with performance reviews (Stone 1995; Damron 1996) • Student evaluations change focus from a consumerist approach by measuring and improving a course to a mercantilist approach of faculty “pleasing the customer.” (Renner 1981; Goldman 1993; Bonetti 1994)
Problem • Sparsity of longitudinal studies on the effects of grade inflation within the IS discipline • An “A” should indicate superior performance among a peer-group – not the general population of students in the U.S. • Faculty face increasing pressures to give higher grades • Many faculty equate a better grade with better student evaluations • Parents want perceived “value” for their investment • College administrators use GPA and student evaluations as a measure of quality from many departments
Research Questions • Has grade inflation occurred within the degree programs of a CIS department in a large, southeastern university over the past ten years? • What is the impact on the expected grades students receives on their performance evaluation of faculty?
Hypotheses • H1: There has been a steady increase of higher grades given to students in the CIS Department by full-time faculty over the past decade • H1a: The percentage of “A”s given has steadily increased • H1b: The percentage of “B”s given has steadily increased • H1c: The percentage of “C”s given has steadily decreased • H1d: The percentage of “D”s given has steadily decreased • H1e: The percentage of “F”s given has steadily decreased
Hypotheses (cont’d) • H2: Students will give higher evaluations to full-time faculty if they expect a high grade. • H2a: Students expecting an “A” will give faculty higher evaluations • H2b: Students expecting an “B” will give faculty higher evaluations • H2c: Students expecting an “C” will give faculty lower evaluations • H2d: Students expecting an “D” will give faculty lower evaluations • H2e: Students expecting an “F” will give faculty lower evaluations
Research Design • Ten year period utilized (Fall 1992 to Fall of 2002) • Only permanent, faculty-of-rank used • Criteria-based testing methodology courses were eliminated from the dataset • Percentage of grades within each course was used rather than raw numbers • Usable data consisted of 36,147 grades assigned by faculty-of-rank in 1,382 courses • ( original data set included 58,315 grades assigned in 1931 courses) • Student Evaluation of Instructor Performance (SEIP) standardized form used to measure faculty performance
Results – Grade Inflation • Significant increase in the percentage of “A”s, while a concurrent decrease in “C”s and “F”s (p-values ≤ .000) • When the analysis is broken down to undergraduate (20,708 grades in 780 courses) vs. graduate 15,295 grades in 593 courses), the results indicate the problem arises primarily with the undergraduate program • However, the percentage of “C”s given to graduate students has decreased over the decade • Support for hypotheses H1a, H1c, and H1e
Results – The effect of the students’ expected grades on their evaluation of faculty • Giving “A”s did not significantly increase overall positive evaluations of faculty • Giving “A”s to undergraduates marginally effected undergraduate evaluations of faculty (p-value ≤ .05) • Giving “C”s to undergraduate student significantly effected faculty evaluations at p-value ≤ .000 • Giving “D”s to undergraduates significantly effected faculty evaluations at p-value ≤ .01 • Fairly good support for hypotheses H2c and H2d
Limitations • Use of secondary data limits the strength of the relationships found; i.e., no data on possible mediating variables or covariates • Variation in testing and grading philosophies of faculty; e.g., some faculty may use the same exams even though the quality of the CIS major has increased over the decade • Similarly, the exam quality and validity differ from faculty member to faculty member • Graduate students are placed on academic probation if they earn a “C” and therefore, faculty may be reticent to give lower grades to graduates. Difficult to show significance when “A”s and “B”s are the primary grades distributed. • Graduate students are older, more mature with better work experience • Generalizability of results may not hold • The students’ expected grades were used as the independent variable for H2. The actual grade for each student and his or her evaluation would add more credence to the results. However, since the SEIPs were administered anonymously, this was not possible • It is not known whether SEIP evaluations had an impact on how faculty graded future courses (further study needed)
Conclusions • Undergraduates experience the greatest levels of grade inflation • In part, grade inflation exists because of pressures on faculty to achieve high teaching evaluations • A de-coupling of the existing student evaluation methodology is needed • There is little support from college and university administrators to change the status quo • Faculty committees need to place a higher priority to adequate teaching evaluation of faculty with college and university administration • Undergraduates expecting a “C” will negatively evaluate faculty’s performance • Possibly because faculty treat undergraduate students differently than their graduate counterparts and are willing to give “C”s • Less maturity in age and job experience with undergraduate students may result in blaming the faculty member rather than accepting responsibility • Faculty should provide students with a more realistic expectation and explanation of their grading system
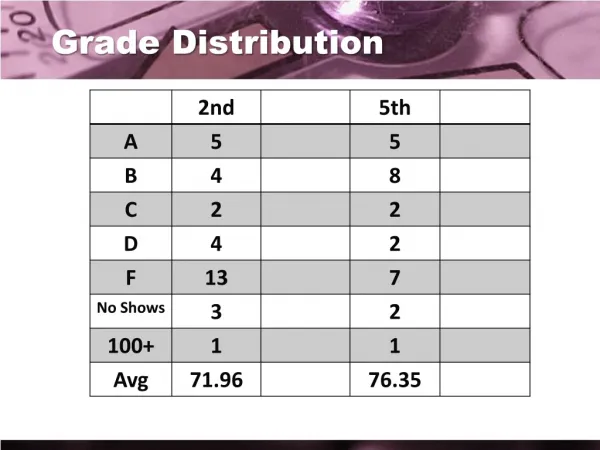
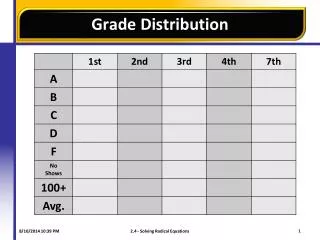
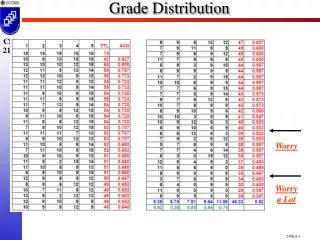
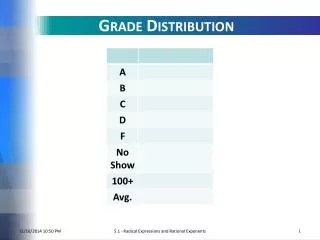
TABLES Table 1. Grade Distribution: Graduate and Undergraduate Programs (1992-2002) * indicates p-value < .001 Table 2. Grade Distribution - Undergraduate Program (1992-2002) * indicates p-value < .001 Table 3. Grade Distribution: Graduate Program (1992-2002) ** indicates p-value < .05
Table 4. The Effect of the Expected Grade Students Would Receive on Their Perception of Faculty Effectiveness: Graduate and Undergraduate Programs (1992-2002) * indicates p-value < .001 ** indicates p-value < .05 Table 5. The Effect of the Expected Grade Students Would Receive on Their Perception of Faculty Effectiveness: Undergraduate Programs (1992-2002) * indicates p-value < .001 ** indicates p-value < .05 Table 6. The Effect of the Expected Grade Students Would Receive on Their Perception of Faculty Effectiveness: Graduate Programs (1992-2002)