Understanding and Plotting Points in a Coordinate Plane: A Comprehensive Guide
This guide covers the essentials of plotting points in a coordinate plane, focusing on key concepts like the x-coordinate, y-coordinate, axes, and ordered pairs. Learn to identify the origin, quadrants, and scatterplots, along with practical examples for plotting specific points and graphing functions. The guide also includes step-by-step instructions for creating tables and identifying ranges for various functions. By mastering these principles, you will gain a solid foundation for working with graphs and data visualization.

Understanding and Plotting Points in a Coordinate Plane: A Comprehensive Guide
E N D
Presentation Transcript
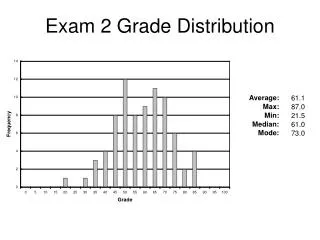
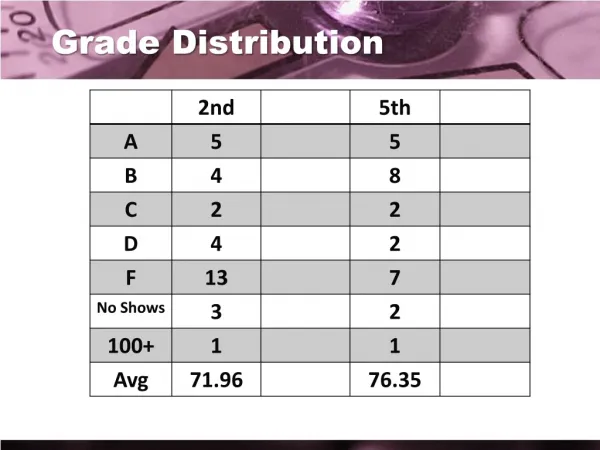
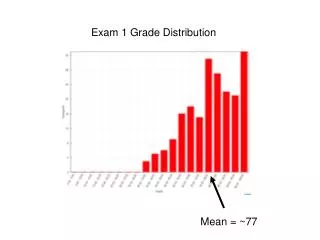
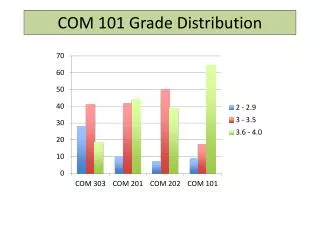
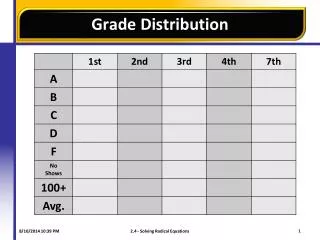
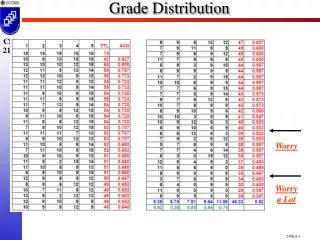
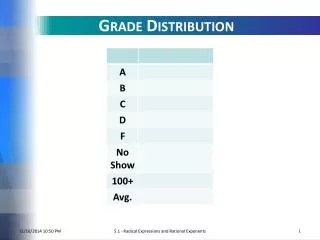
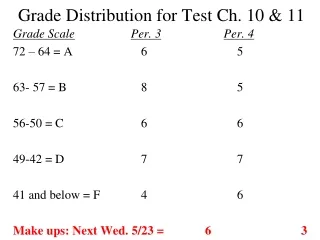
Grade Distribution 4.1 – Plot Points in a Coordinate Plane
Plot Points in a Coordinate Plane Section 4.1 4.1 – Plot Points in a Coordinate Plane
Definitions • X–coordinate is a point that lies left and right • Y–coordinate is a point that lies up and down • X–axis is horizontal axis • Y–axis is vertical axis • Independent Variable is on the x–axis • Dependent Variable is on the y–axis • Ordered pair is a pair with an x–coordinate and a y–coordinate (x, y) • Coordinate plane is a grid system to graph ordered pairs • Origin is where all the points start off at. (0, 0) • Scatterplots are horizontal and vertical axes to plot data points 4.1 – Plot Points in a Coordinate Plane
What’s the point? Determine the x and y–coordinate of this point (2, 4) X–coordinate Y–coordinate 4.1 – Plot Points in a Coordinate Plane
The plane truth Y–axis X–axis 4.1 – Plot Points in a Coordinate Plane
Example 1 Plot (2, 4) into the coordinate plane Point: (2, 4) Start here (0,0) origin 4.1 – Plot Points in a Coordinate Plane
Your Turn Identify the points of letters A, B, and plot (4, 7/4) (1, 6) A (2, 3.5) B 4.1 – Plot Points in a Coordinate Plane
Coordinate Plane • Consist of 4differentquadrants • Quadrant I: (+,+) • Quadrant II: (–,+) • Quadrant III: (–,–) • Quadrant IV: (+,–) • Graph goes counter clockwise 4.1 – Plot Points in a Coordinate Plane
Coordinate Plane 4.1 – Plot Points in a Coordinate Plane
Example 2 Plot point (4, –2) and identify what quadrant it is located at. 4.1 – Plot Points in a Coordinate Plane
Example 3 Plot point (0, –2) and identify what quadrant it is located at. 4.1 – Plot Points in a Coordinate Plane
Your Turn Plot point (–2, 0) and identify what quadrant it is located at. 4.1 – Plot Points in a Coordinate Plane
Steps in Graphing a Function Make a table by substituting the domain into the function List the ordered pairs with parenthesis Identify the range 4.1 – Plot Points in a Coordinate Plane
Example 4 Graph the function y = 2x – 1 with the domain –2, –1, 0, 1, and 2 and identify the range of the function 4.1 – Plot Points in a Coordinate Plane
Example 5 Graph the function y = –1/3x + 2 with the domain –6, –3, 0, 3, and 6 and identify the range of the function 4.1 – Plot Points in a Coordinate Plane
Your Turn Graph the function y = –1/2x + 1 with the domain –4, –2, 0, 2, and 4 and identify the range of the function 4.1 – Plot Points in a Coordinate Plane