Download
1 / 6
60 likes | 77 Views
This study presents a nonparametric methodology to estimate the amount of precipitating ice using multiple-frequency radar reflectivity observations. The algorithm is developed using in-situ particle size distributions and shows good agreement with in-situ estimates. The results have implications for water resource management, severe weather forecasting, and understanding the atmosphere's thermal structure.

E N D
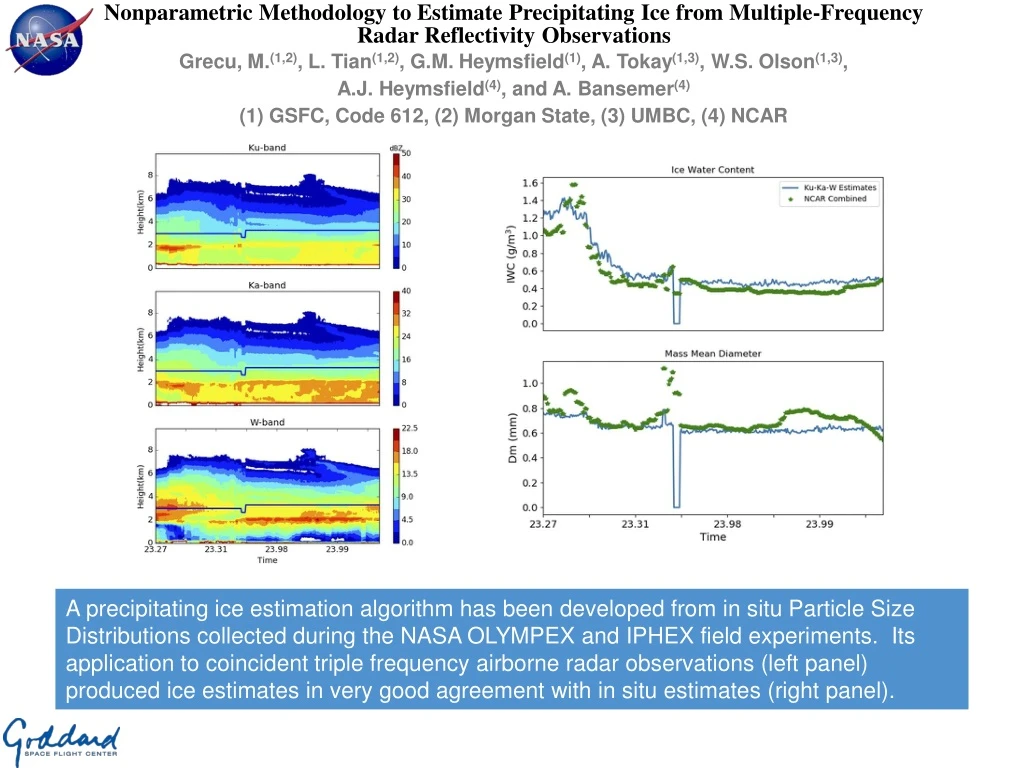
Nonparametric Methodology to Estimate Precipitating Ice from Multiple-Frequency Radar Reflectivity Observations Grecu, M.(1,2), L. Tian(1,2), G.M. Heymsfield(1), A. Tokay(1,3), W.S. Olson(1,3), A.J. Heymsfield(4), and A. Bansemer(4) (1) GSFC, Code 612, (2) Morgan State, (3) UMBC, (4) NCAR A precipitating ice estimation algorithm has been developed from in situ Particle Size Distributions collected during the NASA OLYMPEX and IPHEX field experiments. Its application to coincident triple frequency airborne radar observations (left panel) produced ice estimates in very good agreement with in situ estimates (right panel).
Name: Mircea Grecu, NASA/GSFC, Code 612 and Morgan State University E-mail: Mircea.grecu-1@nasa.gov Phone: 301-614-6322 References: Grecu, M., L. Tian, G.M. Heymsfield, A. Tokay, W.S. Olson, A.J. Heymsfield, and A. Bansemer, 2018: Nonparametric Methodology to Estimate Precipitating Ice from Multiple-Frequency Radar Reflectivity Observations. Journal of Applied Meteorology and Climatology,57, 2605–2622, https://doi.org/10.1175/JAMC-D-18-0036.1 Data Sources: Reflectivity observations from the NASA High-Altitude Imaging Wind and Rain Airborne Profiler (HiWRAP) and the the Cloud Radar System (CRS) collected during the joint Olympic Mountains Experiment and Radar Definition Experiment for Aerosol–Cloud–Ecosystem (ACE) field campaign (OLYMPEX/RADEX) have been used http://dx.doi.org/10.5067/GPMGV/OLYMPEX/DATA101 Technical Description of Figures: Graphic 1: Triple-frequency reflectivity observations collected by the HIWRAP/CRS during OLYMPEX on 1 Dec 2015. The blue lines indicate the altitude of the Citation airplane. Graphic 2: (top) Precipitating ice water content derived from the triple-frequency radar observations and estimates from the 2D-S and HVPS instruments on board the Citation airplane and (bottom) Dm from the radar observations and the Citation instruments. The precipitation ice water content and Dm estimates derived from the combined 2D-S and HVPS observations are derived using a methodology developed at the National Center for Atmospheric Research (NCAR). Scientific significance, societal relevance, and relationships to future missions: Precipitating ice (i.e. snow) is an important component of the earth’s hydrological cycle. Over land, in some regions and seasons, precipitating ice reaching the ground may be the only form of precipitation, and therefore it is very important for water resources management and planning. Also, over land, precipitating ice may be associated with severe weather that impacts human lives. Over land or oceans, precipitating ice is important because it influences the atmosphere’s thermal structure through release of latent heating and radiative cooling. Estimates of precipitating ice derived from single-frequency radar observations are inherently uncertain. Uncertainties stem in the complex variability of particle size distributions and the fact that electromagnetic-scattering properties of solid precipitation cannot be uniquely expressed as a function of their equivalent sizes. To mitigate these uncertainties, a precipitating ice estimation algorithm has been developed from in situ particle size distributions collected during the NASA OLYMPEX and IPHEX field experiments. Its application to coincident triple frequency airborne radar observations produced ice estimates in very good agreement with in situ estimates. The algorithm is applicable to observations from future satellite missions such as Aerosol, Clouds, Convection and Precipitation (ACCP) Mission. Earth Sciences Division - Atmospheres
Extending the MODIS Cloud Product Data Record to SNPP-VIIRS Kerry Meyer (Code 613 NASA/GSFC); Steven Platnick (Code 610AT NASA/GSFC); Steve Ackerman, Bob Holz (U. Wisc.); Andrew Heidinger (NOAA); and others Level-2 Example: Cloud Optical Thickness Level-3 Monthly Time Series Examples North Pacific Region Aqua MODIS SNPP VIIRS Solid lines closer together than dotted line => improved continuity with a common algorithm Level-3 Monthly Example: Liquid Cloud Fraction (Common Algorithm = CLDPROP, MYD08 = EOS Algorithm) Creating long-term time series of satellite-derived cloud properties for climate research requires coupling the data records of multiple, and often differing, sensors. The recently released CLDMSK (cloud mask) and CLDPROP (cloud top and optical properties) products are a result of an effort to bridge NASA’s EOS-MODIS and operational SNPP-VIIRS eras using a common algorithm.
Name: Kerry Meyer, NASA/GSFC, Code 613 E-mail: kerry.meyer@nasa.gov Phone: 301-614-6186 References: Frey, R., S. Ackerman, R. Holz, S. Dutcher (2019), The Continuity MODIS-VIIRS Cloud Mask (MVCM) User Guide, https://modis-atmosphere.gsfc.nasa.gov/sites/default/files/ModAtmo/MODIS_VIIRS_Cloud-Mask_UG_Feb_2019.pdf Platnick, S., A. Heidinger, K. Meyer, R. Holz, et al. (2019), EOS MODIS and SNPP VIIRS Cloud Properties: User Guide for the Climate Data Record Continuity Level-2 Cloud Top and Optical Properties Product (CLDPROP), https://modis-atmosphere.gsfc.nasa.gov/sites/default/files/ModAtmo/EOSSNPPCloudOpticalPropertyContinuityProductUserGuidev1.pdf Data Sources: Data from NASA’s Moderate-resolution Imaging Spectroradiometer (MODIS) onboard the Aqua satellite and the Visible Infrared Imaging Radiometer Suite (VIIRS) onboard the NASA/NOAA Suomi National Polar-orbiting Partnership (SNPP) satellite are used. The CLDMSK and CLDPROP products, publicly released in April 2019, are archived and distributed by the LAADS DAAC at NASA GSFC (https://ladsweb.modaps.eosdis.nasa.gov/). Technical Description of Figures: Graphic 1 (top left): Cloud optical thickness for liquid (warm colors) and ice (cool colors) clouds retrieved using the common algorithm CLDPROP applied to concurrent observations on 3 February 2014 from Aqua-MODIS (left, observation time 2145 UTC) and SNPP-VIIRS (right, observation time 2130 UTC). Graphic 2 (bottom left): Fraction of observations during February 2014 having liquid phase clouds derived from the common algorithm CLDPROP applied to SNPP-VIIRS (left), along with differences with respect to Aqua-MODIS liquid cloud fractions derived from CLDPROP (center) and the heritage EOS algorithms (MYD06, MYD08, right). Graphic 3 (right): Monthly time series of daytime cloud fraction (top), mean cloud top pressure (middle), and mean liquid cloud droplet effective radius retrieved from reflectance in the 2.1-2.25µm spectral region (bottom). Solid lines represent the common CLDPROP algorithm applied to Aqua-MODIS (blue) and SNPP-VIIRS (red); the dotted blue lines represent the EOS algorithms (MYD35, MYD06, MYD08) applied to Aqua MODIS. Scientific significance, societal relevance, and relationships to future missions: Observational studies aimed at detecting and assessing meaningful climate trends require long-term, stable, global data records spanning multiple decades. While Earth-observing satellites can provide the necessary global perspective, multi-decadal data records require coupling the observational records of multiple, often different, satellite remote sensing instruments. For clouds, NASA’s MODIS onboard the EOS Terra and Aqua platforms has offered unique capabilities for retrieving key geophysical parameters such as cloud-top pressure, cloud optical thickness, and effective particle size. However, though their missions are expected to extend into the early 2020s (20+ year data records), these data records alone are insufficient for establishing cloud climate trends. The VIIRS imager onboard the joint NASA/NOAA SNPP satellite, as well as the NOAA operational series JPSS, offers the opportunity to extend the EOS MODIS data records well into the 2030s. The recently released CLDMSK (cloud mask) and CLDPROP (cloud-top and optical/microphysical properties) data products represent NASA’s effort to bridge the MODIS and VIIRS data records. Both CLDMSK and CLDPROP follow a “least common denominator” approach to data record continuity, accounting for key spectral channel differences between the two sensors by utilizing a subset of spectral channels common to both imagers. This has clear advantages versus an approach that attempts to couple VIIRS to the existing heritage EOS MODIS products, e.g., MYD06 (see Graphics 2 and 3). Nevertheless, a number of issues that impact cloud optical/microphysical property continuity are still being investigated, such as inter-sensor differences in spatial resolution, pixel growth across swath, sampling of successive scan overlap, relative radiometry, etc. Earth Sciences Division - Atmospheres
40-year Multi-Satellite Volcanic Sulfur Dioxide (SO2) Global Database released as part of MEaSUREs SO2 project S. A. Carn1, N. A. Krotkov2, B.L. Fisher2,3, C. Li2,4, Peter Leonard5 1Michigan Technological University, 2NASA GSFC (614), 3SSAI, 4ESSIC, 5Adnet The volcanic SO2 climatology from 1978-present reveals highly variable inter-annual volcanic SO2 forcing dominated by two major eruptions (El Chichon in 1982 and Pinatubo in 1991), with the post-2000 period dominated by smaller eruptions. Although none of these smaller eruptions have, individually, produced measurable climate effects, collectively they have garnered significant interest as they may play an important role in sustaining the persistent, background stratospheric aerosol layer, which is an important factor in global climate forcing. Multi-decadal record of global SO2 emissions by volcanic eruptions observed by NASA’s fleet of satellites observing TOA UV radiances. Eruptions (star symbols) are color-coded by estimated plume altitude. The annual total explosive volcanic SO2 production (omitting SO2 discharge from effusive eruptions) is shown in black. Reference: Simon Carn (2019), Multi-Satellite Volcanic Sulfur Dioxide L4 Long-Term Global Database V3, Greenbelt, MD, USA, Goddard Earth Science Data and Information Services Center (GES DISC), Accessed: 18 February 2019, https://doi.org/10.5067/MEASURES/SO2/DATA404
Name: Simon Carn, Nickolay Krotkov • Affiliation: Michigan Technological University NASA/GSFC/614 • Email: scarn@mtu.edunickolay.a.krotkov@nasa.gov • Reference: • Simon Carn (2019), Multi-Satellite Volcanic Sulfur Dioxide L4 Long-Term Global Database V3, Greenbelt, MD, USA, Goddard Earth Science Data and Information Services Center (GES DISC), Accessed: [Data Access Date], 10.5067/MEASURES/SO2/DATA404 • Data Sources: • Multi-decadal record of SO2 emissions by volcanic eruptions observed by NASA’s fleet of satellites observing TOA UV radiances. • Orange lines above the plot indicate the operational lifetimes of NASA UV satellite instruments: Nimbus-7 (N7), Meteor-3 (M3), ADEOS (AD), and Earth Probe (EP) TOMS, OMI (currently operational), and SNPP/OMPS (currently operational), along with the European Sentinel-5P/TROPOMI (currently operational). • Technical Description of Figure: • Total volcanic SO2 total mass in kilotons measured by NASA satellite UV spectrometers for explosive eruptions in 1978-2018. • Eruptions (star symbols) are color-coded by estimated plume altitude, derived from a variety of sources, including Smithsonian Institution Global Volcanism Program volcanic activity reports, volcanic ash advisories, and satellite data. • The annual total explosive volcanic SO2 production (omitting SO2 discharge from effusive eruptions) is shown in black. • Scientific significance and societal relevance and relationship to future missions: • Stratospheric loading of volcanic SO2 by major eruptions leads to the formation of sulfuric acid (or sulfate) aerosols that scatter incoming solar shortwave radiation and absorb outgoing thermal radiation over timescales of months to years, cooling the troposphere and warming the stratosphere • Volcanic eruptions can also release reactive halogen species into the atmosphere, such as chloride and bromide. Halogens can impact the total column ozone amount and profile shape if injected into the lower stratosphere, but sulfate aerosols are also required to catalyze the heterogeneous chemical reactions that can efficiently deplete ozone. Hence, to understand the impacts of volcanic eruptions on climate, and in order to predict possible outcomes in the event of a major eruption, long-term satellite measurements of volcanic SO2 emissions are essential. • The volcanic SO2 climatology from 1978-present reveals highly variable inter-annual volcanic SO2 forcing dominated by two major eruptions (El Chichon in 1982 and Pinatubo in 1991), with the post-2000 period dominated by smaller eruptions. Although none of these smaller eruptions have, individually, produced measurable climate effects, collectively they have garnered significant interest as they may play an important role in sustaining the persistent, background stratospheric aerosol layer, which is an important factor in global climate forcing. • The NASA volcanic SO2 database is used by the modeling community, e.g., • interactive stratospheric aerosol model intercomparison project (ISA-MIP) of the Stratospheric Sulfur and its Role in Climate (SSiRC) group (http://www.sparc-ssirc.org/), part of the international Stratosphere-troposphere Processes And their Role in Climate (SPARC) effort, which aims to constrain and improve interactive stratospheric aerosol models in order to reduce the RF uncertainty. • NASA’s Global Modeling and Assimilation Office, • international Global Emission Initiative (http://www.geiacenter.org/) • AeroCom modeling groups • Our measurements of volcanic SO2 emissions can be integrated with models of magma dynamics to improve eruption forecasts, but the databases must be of sufficient duration to capture the long life cycles of volcanoes (i.e., multi-decadal). The release of our database also coincides with a major effort to improve constraints on global volcanic CO2 emissions (the Deep Carbon Observatory; https://deepcarbon.net/content/reservoirs-and-fluxes), which are challenging to measure directly and are hence estimated indirectly using SO2 emissions data in conjunction with CO2/SO2 ratios. Earth Sciences Division - Atmospheres