Phylogenetics and Coalescence
270 likes | 501 Views
Phylogenetics and Coalescence . Goals. Construct phylogenetic trees using the UPGMA method Use nucleotide sequences to construct phylogenetic trees using UPGMA, NJ, and Maximum Parsimony methods Use coalescent simulation to determine historical change in N e

Phylogenetics and Coalescence
E N D
Presentation Transcript
Goals • Construct phylogenetic trees using the UPGMA method • Use nucleotide sequences to construct phylogenetic trees using UPGMA, NJ, and Maximum Parsimony methods • Use coalescent simulation to determine historical change in Ne • Interpret coalescent trees to draw inferences about human migrations
Phylogenetic Methods • Scope of the problem • Number of possible unrooted trees for n OTUs: • For 10 taxa -> 2,027,025 possible unrooted trees. • Need an optimality criterion
Phylogenetic methods • Distance methods. 1. Unweighted Pair Group Methods using Arithmetic averages(UPGMA). 2. Neighbor Joining (NJ). 3. Minimum evolution(ME). B. Character based methods. 1. Maximum Parsimony (MP). 2. Maximum Likelihood (ML). 3. Bayesian Method (BA)
UPGMA Step 1: Generate data (Sequence/ Genotype/ Morphological) for each OTU.
Step 2: Calculate p- distance for all pairs of taxa. Distance can be calculated by using different substitution models: 1. # of nucleotide differences. 2. p-distance. 3. JC distance 4. K2P distance. 5. F81 6. HKY85 7.GTR etc = 0.142857143
Step 3: Calculate distance matrix for all pairs of taxa and select pair of taxa with minimum distance as new OTU. 0.714 Human Chimpanzee 0.714
Step 4: Recalculate new distance matrix, assuming human and chimpanzee as one OTU. = 0.3571
Step 5: Select pair of taxa with minimum distance as new OTU. Human 0.071 0.107 0.071 Chimpanzee 0.179 Gorilla
Step 6: Again select pair of OTU with minimum distance as new OTU and recalculate distance matrix. = 0.5714
Step 7: Again select pair of taxa with minimum distance as new OTU. Human 0.071 0.107 0.071 Chimpanzee 0.107 0.179 Gorilla 0.286 Orangutan
Step 8: Again select pair of OTU with minimum distance as new OTU and recalculate distance matrix. = 0.7857
Step 9: Again select pair of OTU with minimum distance as new OTU and make final rooted tree. Human 0.071 0.107 0.071 Chimpanzee 0.107 0.179 Gorilla 0.107 0.286 Orangutan 0.393 Gibbon
Branch Supports Bootstrap support. Jack-knife support. Bremer support. Posterior probability support.
Bootstrap support Step 1: Randomly make “n” pseudo-replicates of the data with replacement and make tree from each replicate.
Bootstrap support Step 2: Make consensus tree of trees obtained from all pseudo replicates.
Phylogenetic Software available PAUP. Phyllip. MrBayes. Mega.
Problem 1. File mt_primates.meg contains the sequence data used to calculate the genetic distances in Example 1. Use Mega to build phylogenetic trees based on: • UPGMA. • The NJ Method. • Maximum Parsimony. Compute bootstrap confidence in the internal nodes of each tree. Compare the trees derived using each of these methods. Which do you think is the most informative? Does the computational efficiency of the UPGMA method result in misleading results in this case?
Problem 1.File mt_primates.meg contains the sequence data used to calculate the genetic distances in Example 1. • Use Mega to build phylogenetic trees based on: • UPGMA. • The NJ Method. • Maximum Parsimony. • Compute bootstrap confidence in the internal nodes of each tree. • Compare the trees derived using each of these methods. Which do you think is the most informative? Does the computational efficiency of the UPGMA method result in misleading results in this case? Problem 2.File pdha1_human.meg contains haplotypes detected by sequencing a 4.2-kb region of the X-linked Pyruvate Dehydrogenease E1 α Subunit (PDHA1) in 16 African and 19 non-African males. Use Mega to build a phylogenetic tree based on the NJ Method and interpret the results in the light of hypotheses about the origin of modern humans.
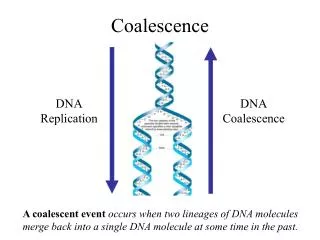
Coalescence Wright-Fisher Model • Until now we have implicitly used the Wright-Fisher Model • Computationally expensive
The Discrete Coalescent • Probability that two genes have MRCA j generations ago • Probailitythat 2 genes out of k have a common ancestor j generations ago Probability of no coalescence for j – 1 generations Probability of coalescence in the jth generation Probability of no coalescence in k lineages for j – 1 generations Probability of coalescence in the jth generation
The Continuous Coalescent • Can derive continuous exponential function from discrete geometric representation • Waiting time (T) for k genes to have k-1 ancestors (See math box 3.2 in Hamilton, 2009)
Coalescent Applications • Coalescent topologies can be dependent upon convolution of Ne andμ, migration rate, selection, recombination rate. • Applications • Estimating recombination rates • Estimating historical migration rates between poulations • Estimating tMRCA • Estimating historical effective population size • Estimating strength of selection
From Data to Coalescence • Suppose we observe n genes with k mutations • We want to get θ=4Neμ but do not know its true value • Can calculate likelihood of θ for a bunch of possible values and find the one with highest probability
MCMC • Sample a new history from a distribution of histories (topologies + waiting times) • Divide the likelihood of this new history by the likelihood of the last history sampled • With probability proportional to this likelihood ratio, move to the new point. • Repeat steps 1-4.
Problem 3.Fossil and molecular based evidence have both provided strong evidence for the divergence of the human and chimpanzee (Pan troglodytes) lineages approximately 6 million years ago. However, timings and locations of human expansions beyond Africa have proved controversial. • Use the Bayesian MCMC software BEAST to derive coalescent trees for sequences from the X-linked Pyruvate Dehydrogenase E1-alpha Subunit gene that you also analyzed in Problem 2. • Have you effectively sampled parameter space for all estimates? How do you know? What might cause insufficient sampling? • What are times to the most recent common ancestor of all Europeans? Africans? Human beings? The human/Pan split? Do these seem reasonable? What is your interpretation of these results? Use the available literature on human evolution to support your claims. • How has the effective population size of humans changed over time? What might this indicate? • How does the best-fit coalescent tree derived by TreeAnnotator compare to the Neighbor Joining tree you generated in Problem 2? What might account for the differences? • GRADUATE STUDENTS ONLY: Does this tree support the hypothesis for a single African origin of Eurasian populations? • If so, which African lineage is most closely related to the Eurasian lineages? • Are the African and Eurasian lineages monophyletic? • How do you interpret this result? What are the limitations of your inferences?