Phylogenetics
650 likes | 849 Views
Phylogenetics. Phylogenetic Trees. time. NODE. BRANCH. Hypothetical Taxonomic Unit. ROOT. Operational Taxonomic Unit (OTU). time. Information. Branching order (topology) Relative closeness of different taxa Branch length Amount of divergence. A. B. Rooted and unrooted trees. C.

Phylogenetics
E N D
Presentation Transcript
Phylogenetic Trees time
NODE BRANCH Hypothetical Taxonomic Unit ROOT Operational Taxonomic Unit (OTU) time
Information • Branching order (topology) • Relative closeness of different taxa • Branch length • Amount of divergence
A B Rooted and unrooted trees C A D B C D E E UNROOTED ROOTED
A B Rooted and unrooted trees E A B C D D E C UNROOTED ROOTED
Rooted and unrooted trees A A E B B C D D E C UNROOTED ROOTED
ROOTED UNROOTED 3 OTUs A A C B B B C A A C B C A A A 4 OTUs C A B B B C C C D D D B D B A A D C C D B A C … 15 rooted trees of 4 OTUs B D
Monophyletic & Paraphyletic Birds Crocodiles REPTILES Snakes and lizards Turtles and tortoises Mammals
Monophyletic & Paraphyletic • Monophyletic • Natural clade; all of the taxa are derived from a common ancestor • Paraphyletic • Taxonomic group whose most recent common ancestor is shared by another taxon
Reconstruct phylogeny from molecular data ACTGTTACCGA ? ACTGTTACCGA ACTGTTACCGA ACTGTTACCGA ACTGTTACCGA
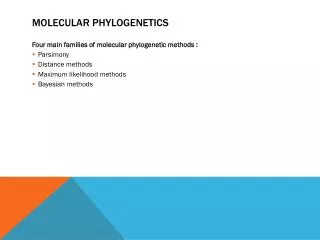
Types of phylogenetic analysis methods • Phenetic: trees are constructed based on observed characteristics, not on evolutionary history • Cladistic: trees are constructed based on fitting observed characteristics to some model of evolutionary history Distance methods Parsimony and Maximum Likelihood methods
Methods of Tree reconstruction • Distance • Maximum Parsimony • Maximum Likelihood • Bayesian Phylogeny Estimation: Traditional and Bayesian Approaches Nature Reviews Genetics (2003) 4:275
Genetic distance • Distance from one sequence to another • Hamming Distance • Count number of differences • Multiple hits – number of events is greater than number of differences • Estimate number of events • Infer tree from genetic distance using Neighbour-joining (NJ) method
UPGMA shown for illustrative purposes. Neighbour-joining is preferred method.
The algorithm in the text means: find the closest distance between two sequences, cluster those; then find the next closest distance, cluster those; as sequences are added to existing clusters find the average distance between existing clusters • Work through the notation! • UPGMA assumes a molecular clock mechanism of evolution
Neighbor-joining: corrects for UPGMA’s assumption of the same rate of evolution for each branch by modifying the distance matrix to reflect different rates of change. • The net difference between sequence i and all other sequences is • ri = Sdik
The rate-corrected distance matrix is then • Mij = dij - (ri + rj)/(n - 2) • Join the two sequences whose Mij is minimal; then calculate the distance from this new node to all other sequences using • dkm = (dim + djm - dij)/2 • Again correct for rates and join nodes.
Maximum Parsimony (MP) • Find topology requiring smallest number of evolutionary changes • Consider each position (site) in the sequence alignment independently • Not all sites are informative • Informative • Favours one topology over others
Informative sites a. A A G A G T T C A b. A G C C G T T C T c. A G A T A T C C A d. A G A G A T C C T a b c a c a d d d b c b
Maximum Likelihood (ML) • Likelihood L of a tree is the probability of observing the data given the treeL = P(data|tree) • Find the tree with the highest L value • Results depends on model of nucleotide substitution • Computationally time-consuming
Actually, all the other methods discussed implicitly use a simple model of evolution similar to the typical model made explicit in maximum likelihood: • All sites selectively neutral • All mutate independently, forward and reverse rates equal, given by m
Also assume discrete generations and sites change independently • Given this model, can calculate probability that a site with initial nucleotide I will change to nucleotide j within time t: • Ptij = dije-mt + (1 - e-mt)gj, where dij = 1 if i = j and dij = 0 otherwise, and where gj is the equilibrium frequency of nucleotide j
The likelihood that some site is in state i at the kth node of a tree is Li(k) • The likelihoods for all states for each site for each node are calculated separately; the product of the likelihoods for each site gives the overall likelihood for the observed data • Different tree topologies are searched to find the highest overall likelihood
Maximum likelihood is maybe the “gold standard” for phylogenetic analysis; but because of its computational intensity it can only be used for select data and only after much initial fine tuning of many parameters of sequence alignments • Often used to distinguish between several already generated trees
Bayesian (B) Phylogeny Estimation • Searches for best trees consistent with both model and data • Incorporates prior knowledge (prior probability) • B maximises probability of tree given data and model • Searches for best set of trees
Comparison of methods How much information are they using? • MP, ML, B use actual DNA whereas NJ summarises information into distance matrix • BUT, not all sites are used by MP (“informative” sites only) How can the nature of the data affect the methods? • NJ better for recent divergences • MP works well for a high number of informative sites
Comparison of methods How do they cope with lots of sequences? • MP requires comparison of all possible trees • Not possible for large number of taxa • ML is computationally intensive and very slow for large number of taxa • NJ efficient for large number of taxa Anything else? • ML requires explicit assumptions about rate and pattern of substitution (model) • ML may perform poorly if model is incorrect • ML or B may get stuck on local maxima
chicken human human mouse mouse rat rat Outgroup rooting of unrooted trees • Outgroup – related sequence that definitely diverged earlier (paleontological evidence)
Rate (r) of evolution • K = number of substitutions per site • T = time since divergence • r = K/2T • Rate is expressed as substitutions per site per year Species A Species B T
Estimating species divergence times • fossil evidence shows that T1 = 310 mya • What is T2 ? • Only need to have sequences and information on one divergence time Chicken (C) Human (B) Rat (A) T2 T1
True tree and inferred tree • There is only one true tree of species relationships • Inferred tree may not be correct • Some genes may not be representative • Tree inference method may have produced an incorrect tree • e.g. parsimony method: may get several equally parsimonious results
How credible is the tree? • The tree is a hypothesis of the true relationship • Need some measure of the support for that hypothesis • Note: Bayesian methods simultaneously estimate tree and measures of uncertainty for each branch
Standard Error of branches Human Chimp Gorilla Orangutan
The bootstrap: randomly sample all positions (columns in an alignment) with replacement -- meaning some columns can be repeated -- but conserving the number of positions; build a large dataset of these randomized samples
Then use your method (distance, parsimony, likelihood) to generate another tree • Do this a thousand or so times • Note that if the assumptions the method is based on hold, you should always get the same tree from the bootstrapped alignments as you did originally • The frequency of some feature of your phylogeny in the bootstrapped set gives some measure of the confidence you can have for this feature
Applications of phylogenetics • Detection of orthology and paralogy • Estimation of divergence times • Reconstruction of ancient proteins • Identifying residues important to selection • Detecting recombination points • Identifying mutations likely to be associated with disease • Determining the identity of new pathogens
The time will come, I believe, though I shall not live to see it, when we shall have fairly true genealogical trees of each great kingdom of Nature. Charles Darwin
The Tree of Life • Traditional classification of life into five kingdoms • Bacteria (inc cyanobacteria) • Protista (inc. cilliates, flagellates, amoebae) • Fungi • Plantae • Animalia
Archaebacteria • Carl Woese and colleagues • Study relationships by comparing rRNAs • Methanogens were expected to group with other bacteria • BUT, found to be equally distant from bacteria and eukaryotes • Made new taxon - Archaebacteria • Includes many extremophiles • thermophiles • hyperthermophiles • halophiles (salt dependent)
lineage 1 Gene A1 lineage 2 lineage 3 Gene A lineage 1 Gene A2 lineage 2 lineage 3 Where is the root of the Tree of Life? • No possible outgroup (by definition) • Iwabe et al. (1989) • Examined phylogenetic tree of pairs of genes that exist in all organisms • derived from gene duplication that predates lineage divergences
Homologous elongation factor genes EF-Tu and EF-G present in all prokaryotes and eukaryotes • Both genes show the same topology Archaea EF-Tu Eucarya Bacteria Archaea EF-G Eucarya Bacteria
Changing view ofThe Tree of Life …(Gaucher et al, 2010) based on morphological characteristics (Chatton, 1925) based on DNA sequence analysis (Woese & Fox, 1977) based on phylogenies of hundreds of genes based on membrane architecture & gene indels based on ancient gene duplication Most modern view …
Human Chimp Gorilla Orangutan Gibbon Phylogeny of humans and apes • Darwin – Gorilla and Chimpanzee our closest relatives and human evolutionary origins in Africa • Many people preferred anthropocentric idea that humans were special Traditional view
So what is the evidence? • Serological precipitation (Goodman 1962) – H, G, C constitute a natural clade, orangutans & gibbons earlier diverging • However, H,G,C relative relationships remained unclear • Most DNA sequence data support ((H,C),G) • Some genes show different relationship Human Chimp Gorilla Orangutan Gibbon
Conservation biology – the dusky seaside sparrow • Last one died June 1987 (DisneyWorld) • Discovered 1872 • Ammodramus maritimus nigrescens • Geographically confined to small salt marsh in Florida • 2000 individuals in 1900 • 6 individuals (all male) in 1980 • Conservation program • artificial breeding
Conservation genetics • Mating of remaining males with females from closest subspecies available • Female hybrids of first generation then “back-crossed” to original males • Continue as long as original males live • Which species to choose to take the females from??
8 other A. maritimus subspecies • Geographically dispersed along coast • Artificial breeding with Scott’s seaside sparrow (A. m. peninsulae) • Chosen based on Morphological and behavioural similarities • Was this the best choice?