Download

1 / 32
320 likes | 524 Views
Organization and technology interventions to improve safe and eco driving. P. D. Davis & I. S. Poonaji. Technology and environmental considerations can drive change fleet safety. Energy Green products Government Reducing cost Lifestyle . Inder Poonaji. Holistic Approach. Planning

E N D
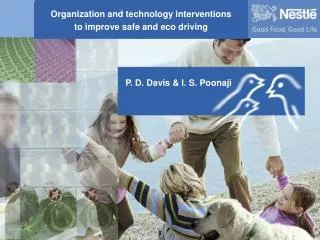
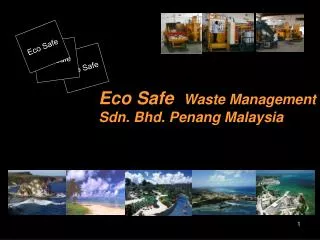
Organization and technology interventions to improve safe and eco driving P. D. Davis & I. S. Poonaji
Technology and environmental considerations can drive change fleet safety • Energy • Green products • Government • Reducing cost • Lifestyle Inder Poonaji
Holistic Approach • Planning • Promotion • Processes • People • Zero waste attitude
Driving • Poor Driving Behaviour has an environmental & economical impact • Interventions can have a significant impact • Use of innovative solutions - Telematics
Poland Telematic Project Aims examine whether new technological advances in Telematics are actually able to influence driver behaviour for improving driving safety and environment KPI’s.
Reasons for actions • ‘Fuel efficient driving is save driving’. • Estimated: Monitoring & training saves 5% on fuel costs. • Running cost: 40 Tonnes GCW Artic Tractor covering 160,000KM a year. Assume 200,000 KM per Year. Fuel Cost = £0.95 per Litre • 3% Saving = £2,200 • 5% Saving = £3,700 • 7% Saving = £5,200 • 10% Saving = £7,400 Source: Transport Engineer. January 2002 analysis of truck operating costs.
System Overview ECM Realtime GPRS Internet connection RSMS Vehicle Systems In vehicle hardware RTL Server Web Browser Example Reports Data feedback to Manager & Driver Check Action Plan DO Methodology • Installation of C3000 in the Pilot Trucks. • Monitoring via Web: • Tracking & Tracing • Driver Efficiency • Driver Safety • Live track of vehicles • Reports • Efficiency report by driver • Efficiency report by vehicle • Safety report by driver • Safety report by vehicle • Utilisation (Terminal) • Utilisation (Vehicle) • Maintenance • Trip Report • Stops Report • Fuel Efficiency • Co2
Scope IN • The proposed trial: Poland Target: Delivery Vehicles • Total number:9 • Trial duration: 12 months. • 1: collecting base line data • 2: training drivers • 3: monitoring • 4. lesson learnt • 5. next steps Out • Non-delivery Vehicles
Business Case • Simple, Scaleable & Flexible. • ROI < 18 months • Using fuel more efficiently means: • Lower costs, improved environmental performance and emissions • Reduced: incidents, cost (insurance premium), damage, unproductive downtime for vehicle repair • Outputs. • Daily SAFED Reports • Reinforcement of procedures, policy, regulations and best practice.
Trial period KPI’s • Improve fuel consumption up to 5% • Determine KPI’s that are significant.
Inter-Dependencies • Local Agreement • Reliability of equipment • Communication by Local Market Team Lead • Driving Policy • Training of Drivers • Depot Managers and Drivers commitment • Web-site links and On-site terminals • Involvement of Group Risk • European Team
Changing behaviour • 3 step process • Turning an unconscious, risky habit into a conscious, self-directed, risky behaviour. • Changing a conscious, self-directed, risky behaviour into a conscious, safe, self-directed behaviour. • Changing a conscious, safe, self-directed behaviour into an unconscious safe habit
Result to date • Poland Project Team • Lech Wardziak • Piotr Starosta • Jerzy Wróblewski
Drivers trained • “I had no awareness of certain factors affecting the economy and driving safety.” • “I think about offensive behaviours and more economical mode of driving.” • Some drivers are concerned about the possibilities of the system. • Daily drivers report.
Efficiency and Safety Reports Efficiency • Fuel Economy • Drive fuel economy • Idle Time • Sweet Spot distance • Top Gear Safety • Harsh Braking • Service Brake • Engine Brake • Over Revving • Speeding • Out of gear coasting Operations • Journey Management • Stop reports • Interface wit system. Reports are generated via a simple-to-use web interface
May ’08 VALUE 19,7l - 24,8l per 100 KM (average 21,8l) AUG ’08 VALUE 17,8l - 19,35l per 100 KM (average 18,8l) TARGET VALUE* 20l /100km – city routes 18l /100km – mixed routes (city + country roads) (*based on Iveco Eurocargo ML100 E17/18 trucks) FUEL ECONOMY L/100KM - fuel consumption per vehicle or driver - 14% The indicator shows the average usage (fuel consumption) achieved during a given period of time.The engine fuel economy less idling and PTO fuelMeasured in kilometres / litre or miles / gallonFuel Economy indicator is depending on the type of vehicle and drivers behaviours.
May ’08 VALUE 5.4% AUG ’08 VALUE 2.1% TARGET VALUE <1.5% IDLE TIME (%) – Stop with running engine - 61% This indicator shows the percentage of time when the vehicle is stopped (over 4 minutes) with the engine running. This leads to fuel wastage.
May ’08 VALUE 31,6%-45% (average 39,1%) AUG ’08 VALUE 86%-91% (average 87,9%) TARGET VALUE over 90% SWEET SPOT DISTANCE (%) – optimum band of RPM (green band) +125% Sweet Spot Optimum revolution band - is between 1100 – 2100. If the driver hits this during each driving motion fuel efficiency will rise.
May ’08 VALUE average 13,3% AUG ’08 VALUE average 1,3% TARGET VALUE <1% OVER REV (%) – Driving a vehicle when exceeded the recommended RPM -12% Over Rev is essentially where the vehicle is revved outside of the Optimum Band. This puts more strain on the engine, thus consuming more fuel
May ’08 VALUE 4%-32% (average 22%) AUG ’08 VALUE 29%-60% (average 39,9%) TARGET VALUE over 60% TOP GEAR (%) +17,9% The indicator shows the percentage of distance travelled on the vehicle’ top gear.By using the top gear as much as possible means that the engine is utilizing the lowest possible rev band and is at its most efficient.
August ’08 VALUE 573.74 g/km Sept ’08 VALUE 498.50 g/km TARGET VALUE <400 g/km Emissions: C02 13% The CO2 report follows the same principal as the Efficiency Report. Conversion of the Fuel Economy figure to show exactly how much Carbon the vehicle is omitting.
May ’08 VALUE 1-9 per week average = 5 AUG ’08 VALUE 3-4 per month average = 3.5 TARGET VALUE 1 per month HARSH BREAKING (COUNT) - 30% Harsh Breaking – The indicator on the report acts as a counter. This is where the driver has had to break so hard that the Seat Belt locks.
May ’08 VALUE 14-18% (average 15,2%) AUG ’08 VALUE 12,7-18% (average 14,7%) TARGET VALUE <15% SERVICE BREAK (%) - 0.5% Service Break is the foot break.This should be positive ratio between this and the Engine Break
May ’08 VALUE average 0.15% AUG ’08 VALUE average 3.54% TARGET VALUE >5% ENGINE BRAKE (%) + 3.4% Engine brake is a device that can convert a diesel engine into an air compressor, a power absorbing device. These devices are used in trucking applications to provide a means for retarding the vehicle, supplementing the normal vehicle braking system. The retarding operation is under full control of the vehicle operator and can be used simultaneously with the normal service brakes. Engine breaking is important as it uses less fuel, and is a more balanced and controlled way to bring the vehicle to a halt or lower speed.
May ’08 VALUE Urban speed under development AUG ’08 VALUE Urban speed under development TARGET VALUE ZERO over speeding OVER SPEEDING (%) 0 The indicator shows the percentage ofdistance travelled exceedingthe maximum allowed speed.In tested trucks (with accordanceto EU requirements) speed has been limited at level of 90km / h. It means driver can not drives faster than 90km/hThe aim is to implement maps with a specific max speed marked on it, to increase control of a driver over speeding inside the urban areas.
May ’08 VALUE average 7,7 % AUG ’08 VALUE average 6,9% TARGET VALUE <3% OUT OF GEAR COASTING (%) -0.8% This stat should be close ZERO. This is where a vehicle is moving not in a gear and is unsafe.
May ’08 VALUE under development AUG ’08 VALUE under development TARGET VALUE 100% Seatbelt usage 0 Distance in which the driver seatbelt is being utilised in comparison with the total driving distance.Safety indicator.Easy to manage / monitor report to ensure safe driving policy is taken on boardReduced risk of serious injury or death in an accident
Incident Alert May ’08 VALUE • under development AUG ’08 VALUE • under development TARGET VALUE • under development 0
Reversing data • May ’08 VALUE • under development • AUG ’08 VALUE • under development • TARGET VALUE 0
! Poland Telematic – some key results FUEL ECONOMY L/100KM SWEET SPOT DISTANCE (%) HARSH BREAKING May 08; 21.8 l per 100 KM Sept 08: 18.8l per 100 KM May 08; Average 39,1% Sept 08: Average 87,9% May 08; Average 5 Sept 08: Average 2 - 14% + 125% - 60%
Conclusion Facts • Reduction in fuel costs • Reduction in emissions • Safer and more intelligent driving • Operational efficiency • Recognise need for sustained training • Behaviour Change Assumptions • Lower vehicle servicing costs • Longer vehicle-life expectancy • Improved overall driving standards • Improved vehicle security • Reduction in risk of accidents / insurance claims