Download
1 / 5
50 likes | 167 Views
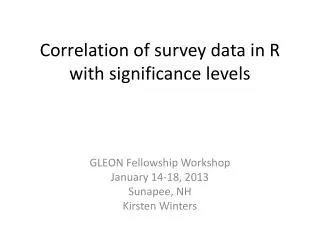
Correlation of survey data in R with significance levels. GLEON Fellowship Workshop January 14-18, 2013 Sunapee, NH Kirsten Winters. What’s the cleanest way to load data?. Relevance of running correlation on survey data. Correlation is quick and easy

E N D
Correlation of survey data in R with significance levels GLEON Fellowship Workshop January 14-18, 2013 Sunapee, NH Kirsten Winters
Relevance of running correlation on survey data • Correlation is quick and easy • In 2008, we surveyed Oregonians (n=3088) on their perceptions of risk to wild salmon and their opinions on related potential policies. • Understanding the correlation between risk perception and policy support is important
Application to data & lessons learned • Imported .csv file much cleaner and easier to navigate • Tried correlation code as advised by QuickR site didn’t include significance levels • Found better source code online which produced results in a table with significance levels starred
Results • Positive correlation with various “strengths”