Download
1 / 27
280 likes | 844 Views
Correlation and the logic of significance testing. Practice.

E N D
Practice • A researcher examines whether being in a room with blue walls, green walls, red walls, or beige walls influences aggressive behavior in a group of adolescents (measured as the number of times the adolescents shock an opponent in a simulated game). • What is the independent variable? • Is the independent variable manipulated or not manipulated? • How many levels are there for the independent variable? • What is the dependent variable? • What is the scale of measurement for the dependent variable?
Practice • A researcher examines whether being subliminally exposed to various novel shapes will increase participants’ liking of the shapes. Some participants subliminally view shapes and others do not. Later, all participants are given a list of shapes and are asked to rank-order their top 5 choices. • What is the independent variable? • Is the independent variable manipulated or not manipulated? • How many levels are there for the independent variable? • What is the dependent variable? • What is the scale of measurement for the dependent variable?
Practice • Q: True or False? If False, explain why. Generally, a small standard deviation implies that the measurements are clustered close to the mean.
Practice • Q: If a constant were to be added to a set of scores, the standard deviation would: • a. remain the same. • b. increase by the square root of that constant. • c. increase by the square of that constant. • d. increase by the magnitude of that constant. e. none of the above.
Practice • Q: If the variance of a distribution is 9, the standard deviation is: • a. 3 • b. 6 • c. 9 • d. 81 • e. impossible to determine without knowing n.
Practice • Q: The following set of scores is obtained on a test, X: 4, 6, 8, 9, 11, 13, 16, 24, 24, 24, 26. The teacher computes all of the descriptive indices of central tendency and variability on these data, then discovers that an error was made, and one of the 24's is actually a 17. Which of the following indices will be changed from the original computation? • a. Median b. Mode • c. Range d. Standard deviation • e. None of the above
Practice • Q: True or False? The standard deviation of a group of scores is 0 when all the scores are the same.
Correlation • Correlation Coefficient • A single number representing the degree of relation between two variables. • The value of a correlation coefficient can range from –1 to +1.
Computing the Correlation Coefficient (Pearson R) • r = 1.73/6 • r = .29 .
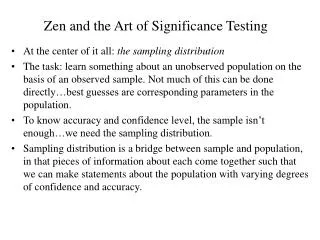
Significance • How correlated do our samples have to be to conclude that the populations they came from are correlated • In other words – do we have a significant correlation?
Logic of significance testing • Null hypothesis – populations are not correlated – correlation in the sample is just due to chance • Alternative hypothesis – populations are correlated
Looking at some analogies • Criminal justice • Law and Order example • Gambling • Fair coin example • Medicine • Irregular cell example • Guessing game • Are numbers in envelope the same or different?
Statistical Evidence • Tables of significance • Sample of correlation table
Practice • Suppose a researcher comes up with a new drug that in fact cures AIDS. She assigns some AIDS patients to receive a placebo, and others to receive the new drug. The null hypothesis is that the drug will have no effect. • In this case, what would be the Type I error? • In this case, what would be the Type II error? • Which do you think is the more costly error? Why?
Practice • A manufacturing company is making smoke detectors. They want to conduct a study to determine how well the smoke detectors work. The null hypothesis in this study is that the smoke detectors will not work. • In this case, what would be the Type I error? • In this case, what would be the Type II error? • Which do you think is the more costly error? Why?
In one famous study (Rosenhan, 1973), eight healthy volunteers (“pseudopatients”) presented themselves to psychiatric hospitals. They told the admissions officers that they had been hearing voices. • All pseudopatients were admitted to the hospitals, where they ceased to pretend they were hearing voices (in other words, they behaved ‘normally’). None of the pseudopatients were detected as sane. • In this study, did the hospital staff commit a Type I or Type II error in calling sane patients insane? • Which would be the more costly error? Why?
If we conclude significance what does it mean • Scores in sample were so highly correlated that it is unlikely that this was due to chance – thus we conclude that populations are correlated.
Significance testing in a simple experiment • Two conditions compared • Are differences between the means of the samples so different that it is likely that the populations that they came from were different • In other words – Is there a significant difference between the groups
Significance testing for differences between means • Null hypothesis: There is no difference between the populations (any differences you find in the samples are due to chance) • Alternative hypothesis: There is a difference between the populations (any difference you find in the samples reflect the differences between the populations)
Test for differences between two means • The t-test • Looks at differences between the means in relation to the variability of the scores
Next time • Different types of t-tests • One tail v Two tail • Understanding the logic of the t-test • Matching the t-test to the experimental method