Download
1 / 35
350 likes | 367 Views
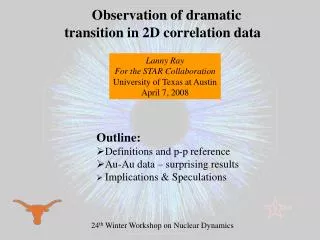
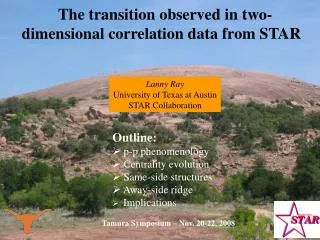
Observation of dramatic transition in 2D correlation data. Lanny Ray For the STAR Collaboration University of Texas at Austin April 7, 2008. Outline: Definitions and p-p reference Au-Au data – surprising results Implications & Speculations. 24 th Winter Workshop on Nuclear Dynamics.

E N D
Observation of dramatic transition in 2D correlation data Lanny Ray For the STAR Collaboration University of Texas at Austin April 7, 2008 • Outline: • Definitions and p-p reference • Au-Au data – surprising results • Implications & Speculations 24th Winter Workshop on Nuclear Dynamics
Introduction and Overview • Our philosophy: determine a “complete” map of the 2-particle • correlations in p-p and A+A collisions, then interpret. • Correlations are sensitive to physical processes: e.g. parton scattering • and fragmentation (jets & minijets), elliptic flow, resonances, HBT, etc. • Each source generally makes a unique contribution,facilitating • decomposition and interpretation. • A surprising trend in same-side correlations was found and first reported • at QM 2008 (M. Daugherity, University of Texas, for STAR). • The implications of these new results suggest a different scenario from • the ubiquitous, rapid thermalization hydrodynamic models for the bulk • collision environment at RHIC.
Begin with Proton-Proton Spectra Two-component soft + (semi)hard model: PRD 74, 032006 (nucl-ex/0606028) + pQCD hard… “semi-hard” “soft” 200 GeV Spp replot on “transverse rapidity” Data – Spp semi-hard component: gaussian on yt pt spectra for increasing Nch
Proton-Proton: spectra to correlations Peak yt=2.66 yt=2.66 yt2 pt ~ 2.0 pt ~ 1.0 pt ~ 0.5 yt1 STAR Preliminary SOFT component – Levy Distribution HARD component – Gaussian on yt(!) PRD 74, 032006
Correlation Measure ρ(p1,p2)= 2 particle density in momentum space ρsibling(p1,p2) Event 1 ρreference(p1,p2) Event 2 Start with a standard definition in statistics: Δρas a histogram on bin (a,b): ε = bin width, converts density to bin counts measures number of correlated pairs per final state particle Normalize
Proton-Proton Components yt2 yt1 p-p transverse correlations p-p axial correlations STAR Preliminary φΔ ηΔ We hypothesize that this structure is caused by semi-hard partonic scattering & fragmentation - minijets soft component semi-hard component φΔ φΔ ηΔ ηΔ Longitudinal Fragmentation: 1D Gaussian onηΔ HBT peak at origin, LS pairs only Minijets: 2D Gaussian at origin plus broad away-side peak: -cos(φΔ)
proton-proton 200 GeV Au-Au Data Analyzed 1.2M minbias 200 GeV Au+Au events; included all tracks with pt > 0.15 GeV/c,|η| <1, fullφ note: 38-46% not shown 84-93% 74-84% 64-74% 55-64% 46-55% φΔ ηΔ 18-28% 9-18% 28-38% 5-9% 0-5% φΔ ηΔ STAR Preliminary We observe the evolution of several correlation structures from peripheral to central Au+Au
62 GeV Au-Au Data Analyzed 13M 62 GeV Au+Au minbias events; included all tracks with pT > 0.15 GeV/c, |η| < 1, full φ note: 37-46% not shown 84-95% 75-84% 65-75% 56-65% 46-56% 18-28% 28-37% 9-18% 5-9% 0-5% STAR Preliminary A similar evolution appears but is delayed on centrality relative to the 200 GeV data.
Fit Function (5 easy pieces) Same-side “Minijet” Peak, 2D gaussian Away-side -cos(φ) Proton-Proton fit function STAR Preliminary “soft” “hard” = + φΔ φΔ φΔ ηΔ ηΔ ηΔ dipole longitudinal fragmentation 1D gaussian HBT, e+e- 2D exponential cos(2φΔ) • Au-Au fit function • Use proton-proton fit function + cos(2φΔ) quadrupole term (“flow”). • This gives the simplest possible way to describe Au+Au data. quadrupole Note: from this point on we’ll include entire momentum range instead of using soft/hard cuts φΔ ηΔ
Same-side 2D gaussian & binary scaling Peak Amplitude Peak η Width Peak φ Width STAR Preliminary STAR Preliminary STAR Preliminary Statistical and fitting errors as shown Systematic error is 9% of correlation amplitude 200 GeV 62 GeV constant widths peripheral central small increase before transition Binary scaling: Kharzeev and Nardi model STAR Preliminary Note the absence of a transition point in the quadrupole: v2 & elliptic flow Deviations from binary scaling represent new physics unique to heavy ion collisions
HIJING minijet predictions Peak Amplitude Peak η Width Peak φ Width STAR Preliminary STAR Preliminary STAR Preliminary 200 GeV 62 GeV HIJING 1.382 default parameters, 200 GeV, quench off Quench on causes slight amplitude decrease The observed minijet correlation is much larger than HIJING (factor of 4) mid (40-50%) HIJING 1.382 very little centrality dependence φΔ ηΔ
Q ~ 2 GeV/c minijets, nucleon KT , acoplanarity Low-x parton KT ~ 1 GeV/c KT broadening pz Low-x parton events 1,2,3… p 0 sum events φΔ p 0 away-side φΔ -3p -pp 3p 0 Dipole – transverse momentum conservation 200 GeV 62 GeV The dipole matches the centrality dependence of the same-side gaussian and shows the same transition point. It’s origin is pt conservation: global + jets STAR Preliminary Global pt conservation
Does the transition point scale? Peak Amplitude Peak Amplitude Peak η Width Peak η Width Bjorken Energy Density Npart STAR Preliminary STAR Preliminary STAR Preliminary STAR Preliminary 200 GeV 62 GeV 200 GeV 62 GeV εBJ εBJ Npart Npart Peripheral bins are compressed. Depends on formation time (assumed 1 fm/c), difficult to compare energies. Peak Amplitude Peak η Width Transverse Particle Density STAR Preliminary STAR Preliminary 200 GeV 62 GeV S = overlap area (Monte Carlo Glauber) Same-side gaussian amplitude and h-width scale with particle density
2D angular correlations for pt pT minijet peak 0-30% centrality = inclusive mean pt Number pt 200 GeV Au+Au Same-side amplitude and widths pt correlations follow binary scaling well past the transition J Phys G 32 L37 This leads to the hypothesis that semi-hard partons continue to underlie the same-side gaussian number correlations above the transition.
Multiplicity fractions – same-side gaussian 1) Probability that minbias p-p collision produces semi-hard parton: 2) Number of semi-hard partons in Au-Au assuming binary scaling (pt correlations) 3) Total number of same-side 2D gaussian correlated pairs per event: 4) Number of final state particles associated with each semi-hard parton: 5) Fraction of total multiplicity associated with same-side gaussian correlation: Peak Volume STAR Preliminary 200 GeV 62 GeV For central Au+Au we estimate about 30%; a significant fraction of the bulk particles. 8x increase See also T. Trainor, arXiv:0710.4504, accepted to J Mod Phys E
(yt,yt) correlations, 200 GeV Au+Au proton-proton How the correlations evolve in transverse momentum (peripheral) (central) STAR Preliminary Sudden onset at lower yt corresponding to transition point for same-side gaussian. Correlations remain at original yt – surface jets? increase at higher yt. (protons: see arXiv:0710.4504)
Implications: Superposition model Expected behavior: • Minijets unchanged, except amplitude increases with binary scaling; widths remain constant. • Minijet peak on (yt,yt) unchanged except for amplitude. Comparison with data: Superposition model approximates data to the transition point but radically fails at higher density, more central collisions. STAR Preliminary
1 2 3 pT minijet peak 0-30% central Implications: parton/hadron scattering model Expected behavior: • Widths of both number and pt angular correlations increase • Amplitude of pt correlation falls below binary scaling • Minijet peak on (yt,yt) dissipates to lower momentum Comparison with data: pt correlation amplitude follows binary scaling beyond transition; doesn’t decrease until here hwidths increase butfwidths decrease Minijet peak dissipates, strength remains at original yt, increases at higher yt
1 2 pT minijet peak 0-30% central Implications: opaque, thermalized medium Expected behavior: • Semi-hard partons stopped; produce local hot spots; isotropic thermal motion - number angular correlations vanish, radially flowing hot spots could produce correlations [e.g. +cos(fD)]. • momentum conserved - pt correlations on h,f may persist • Minijet peak on (yt,yt) completely dissipated; saddle shape appears at lower pt (J.Phys.G 34, 799) Comparison with data: Semi-hard partons persist; number correlations do not vanish, but increase dramatically. Peak Volume STAR Preliminary 200 GeV 62 GeV STAR Preliminary Narrow azimuth width from p-p to central Au-Au, no transition point. • width initially due to minijets. If more central dominated by other mechanisms, the latter must seamlessly match minijets. 8x increase
Implications: opaque, thermalized medium b 3 4 Comparison with data (cont.): Boosted hot spots produce +cos(fD) correlations; opposite sign to data 200 GeV Au+Au peripheral The minijet correlation region in (yt,yt) does not vanish, but increases and extends to higher yt; a saddle shape develops (see J.Phys.G 34, 799) STAR Preliminary central The observed correlations contradict expectations for a rapidly thermalized system.
What causes the reduction in azimuth width? Perhaps there is a competition between collisional broadening and an unknown narrowing mechanism which affects low-pt and depends on the first few N-N collisions. Interpretation: below the transition point STAR Preliminary approximate binary scaling time (lab) minijet fragmentation with moderate hD width increase hadrons moderate scattering and dissipation pre-hadrons z scattered parton beam beam
STAR Preliminary Why does thefwidth remain narrow? Somehow the scattered parton’s azimuth direction of motion is transferred to the bulk hadrons which are associated/correlated with it. Interpretation: above the transition point (personal speculation) STAR Preliminary larger hD width parton fragments plus correlated hadrons spread over much larger hD range time hadrons earlier, stronger momentum dissipation novel QCD environment z scattered parton beam beam
Implications for phenomenology (personal speculation) Novel, 1D Hubble expanding gluon field (in co-moving frame of parton) pz • transverse momentum loss; no change in direction • pt transfered to gluons along z-coordinate • correlation along z maps to width increase on h • pt not transferred on f, azimuth width stays constant • increased number of correlated pairs • pt correlations preserved • But what causes the interaction with the • gluon field to suddenly change at the transition ?
Summary and Conclusions • Angular correlations on (h,f) were shown for Au+Au collisions at 62 and 200 GeV: • large structures associated with semi-hard partons/fragments, dipole and quadrupole. • The same-side 2D peak follows binary scaling (minijets) until an abrupt transition: • number of correlated pairs and h-width increase dramatically; f-width decreases. • The quadrupole, typically interpreted as elliptic flow, does not show the transition. • The transition point occurs at the same transverse particle density at 62 and 200 GeV. • Increased correlations appear due to more soft hadrons being correlated with scattered partons, rather than due to more correlated groups, or clusters (beyond binary scaling). • Up to ~30% of the final state hadrons in central Au+Au are associated with the • same-side 2D correlation peak. • These angular correlations together with pt angular and (yt,yt) correlations contradict • expectations based on rapid thermalization; but do indicate strong modifications of • parton scattering and fragmentation. • Phenomenological implications of these results are suggested.
200 GeV Model Fit model STAR Preliminary 84-93% 75-84% 65-75% 55-65% 46-55% φΔ ηΔ 19-28% 28-38% 9-19% 5-9% 0-5% φΔ ηΔ 26
200 GeV Residual Fit residual = data - model STAR Preliminary 84-93% 75-84% 65-75% 55-65% 46-55% φΔ ηΔ 19-28% 28-38% 9-19% 5-9% 0-5% φΔ ηΔ We have a good fit with the simplest possiblefit function. Other than adding the cos(2φΔ) quadrupole term, no other modification was necessary. 27
Same-side 2D gaussian Peak Amplitude Peak η Width Peak φ Width Statistical and fitting errors as shown Systematic error is 9% of correlation amplitude STAR Preliminary STAR Preliminary STAR Preliminary 200 GeV 62 GeV peripheral central X-axis shows mean participant path-length • Observations • Amplitude and η widths start small and experience a sharp transition • Transition occurs at ~55% centrality at 200 GeV, is more central (~40%) for 62 • φ width has a verydifferent centrality dependence
Consistency Check Does interaction between same-side peak and cos(φΔ) terms cause the transition? Result 200 GeV: standard, two-stage fit Two-stage fit: cos(φΔ) cos(2φΔ) fix cos(φΔ) and cos(2φΔ) on away-side then fit remaining terms ν ν The results are consistent Cancellation in fit terms does not cause the amplitude increases. minijet peak minijet η width ν ν 29
Transition – close-up Does the transition from narrow to broad ηΔ occur quickly or slowly? data - fit (except same-side peak) STAR Preliminary 83-94% 55-65% 46-55% 0-5% ηΔ width Large change within ~10% centrality Smaller change from transition to most central low-pt manifestation of the “ridge” Shape changes little from peripheral to the transition The transition occurs quickly 30
Implications: measures and media Suite of correlation and differential spectra measures: • Number of pair correlations on relative angles: (hD,fD) • pt correlations on (hD,fD) • 2D transverse momentum: (yt,yt) • Charge independent (CI) and dependent (CD) • PID dependent (not yet explored, need TOF) • Differential pt spectra (as in p-p analysis) Three example scenarios for RHIC collision environments: • Superposition of p-p collisions • Parton/hadron scattering, moderate cross sections • Opaque medium, zero mean-free path Focus attention on the 2D same-side gaussian
Quadrupole Component Instead of removing a background, we can make a measurement Data cos(2φΔ) component Amplitudes 200 GeV 62 GeV • 62 and 200 have the same shape • Substantial amp. changewith energy φΔ φΔ ηΔ ηΔ STAR Preliminary STAR Preliminary v2{2} v2{2D} v2{4} D. Kettler, T. Trainor arXiv:0704.1674 accepted to J Mod Phys E flow data from PRC 72 014904 The η-dependence of correlations separates quadrupole from other components 33
Another scenario: opaque core plus novel QCD corona - pt correlations remain - ytxyt dissipates but amplitude remains at minijet yt - same-side 2D gaussian remains But… If an opaque core developed then minijet yield would decrease, but perhaps those that escape from the outer region pick up enough associated particles to make up for the deficit caused by the core to account for what we see. However, many jets will lose their away-side partner, only tangential jets will have the broad away-side correlations to produce the –cos(fD). In this scenario the ratio of dipole to 2D gaussian amplitude decreases. In the STAR data this ratio is flat from pp to central AuAu.
Implications for phenomenology (personal speculation) Semi-hard parton traversing thermal medium: • momentum loss • increased number of correlated pairs • Brownian motion induces h and f • width broadening – the latter is not seen 1D Hubble expanding gluon field (in co-moving frame of parton) • transverse momentum loss; no change in direction • pt transfered to gluons along z-coordinate, not f • correlation along z maps to width increase on h • azimuth width constant • increased number of correlated pairs • pt correlations preserved • But what causes the gluon field • to suddenly change ?