Download
1 / 27
270 likes | 421 Views
5. Measure of Dispersion and Variability. Kuswanto 2007. Ukuran keragaman. Dari tiga ukuran pemusatan, belum dapat memberikan deskripsi yang lengkap bagi suatu data. Perlu juga diketahui seberapa jauh pengamatan-pengamatan tersebut menyebar dari rata-ratanya.

E N D
5. Measure of Dispersion and Variability Kuswanto 2007
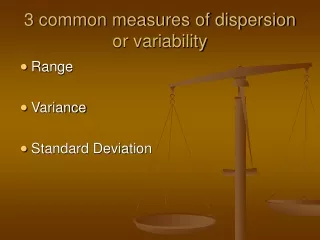
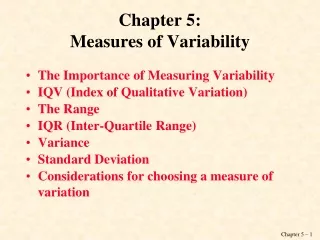
Ukuran keragaman • Dari tiga ukuran pemusatan, belum dapat memberikan deskripsi yang lengkap bagi suatu data. • Perlu juga diketahui seberapa jauh pengamatan-pengamatan tersebut menyebar dari rata-ratanya. • Ada kemungkinan diperoleh rata-rata dan median yang sama, namun berbeda keragamannya. • Beberapa ukuran keragaman yang sering kita temui adalah range (rentang=kisaran=wilayah), simpangan (deviasi), varian (ragam), simpangan baku (standar deviasi) dan koefisien keragaman.
f f X X Measures of Dispersion and Variability These are measurements of how spread the data is around the center of the distribution
2 2 3 4 5 = X1 = X2 = X3 = X4 = X5 • Range Kisaran = Rentang • difference between lowest and highest numbers Place numbers in order of magnitude, then range = Xn - X1. Range = 5 - 2 = 3 Problem - no information about how clustered the data is
2. DEVIATION DEVIASI = SIMPANGAN You could express dispersion in terms of deviation from the mean, however, a sum of deviations from the mean will always = 0. i.e. (Xi- X) = 0 So, take an absolute value to avoid this Problem –the more numbers in the data set, the higher the SS
Sample SS = (Xi - X)2 = Sample mean deviation = | Xi- X | n 3. Mean Deviation = Simpangan Rerata Essentially the average deviation from the mean 4. Variance = Ragam Another way to get around the problem of zero sums is to square the deviations. Known as sum of squares or SS Xi2 - (Xi)2/n n - 1 SS is much more common than mean deviation
Example Sample SS = (Xi - X)2 2 2 3 4 5 = X1 = X2 = X3 = X4 = X5 X = 3.2 = 1.44 + 1.44 + 0.04 + 0.64 + 3.24 = 6.8 SS = (2 - 3.2)2 + (2 - 3.2)2 + (3 - 3.2)2 + (4 - 3.2)2 + (5 -3.2)2 Problem –the more numbers in the data set, the higher the SS
Population Variance (2 ): This is just SS 2 = (Xi - )2 N N Our best estimate of 2is sample variance (s2): S2 = (Xi - X)2 n - 1 Note : divide by n-1 known as degrees of freedom The mean SS is known as the variance Xi2 - (Xi)2/n = n - 1 Problem - units end up squared
= (Xi - )2 N = 2 s = s2 s = (Xi - X )2 n - 1 5. Standard Deviation (Standar Deviasi) => square root of variance For a population: For a sample:
Example 2 2 3 4 5 = X1 = X2 = X3 = X4 = X5 X = 3.2 s = (2 - 3.2)2 + (2 - 3.2)2 + (3 - 3.2)2 + (4 - 3.2)2 + (5 -3.2)2 5 - 1 = 1.44 + 1.44 + 0.04 + 0.64 + 3.24 4 = 1.304 s = (Xi - X )2 n - 1
s CV = X 6. Coefficient of Variation = Koefisien Keragaman = KK (V or sometimes CV): Variance (s2) and standard deviation (s) have magnitudes that are dependent on the magnitudes of the data. The coefficient of variation is a relative measure, so variability of different sets of data may be compared (stdev relative to the mean) Note that there are no units – emphasizes that it is a relative measure X 100% Sometimes expressed as a %
Example: 2 2 3 4 5 = X1 = X2 = X3 = X4 = X5 X = 3.2 g s CV = X 1.304 g CV = 3.2 g CV = 0.4075 or CV = 40.75% (X 100%) s = 1.304 g Attention there is not any UNIT, or %
So probability of one event = 1 # of possible outcomes 7. Probability (Peluang) : Likelihood of an event - represented by P number between 0 and 1 Eg coin toss: probability of heads = 0.5 Eg 2: roll of die: probability of any number = 1/6
Adding and multiplying probabilities: To find prob. Of one event and another event both happening, multiply the probabilities of the two events eg if a coin is tossed twice, what is prob of a head followed by a tail (0.5)(0.5) = 0.25
To find prob. of one event or another event happening, add the probabilities of the two events eg if a die is tossed what is prob of rolling a 2 or a 4? 1/6 + 1/6 = 2/6 = .333
BUT : The biological world is not as clear cut as tossing coins We can guess at a probability by sampling a large data set and expressing relative frequency Relative frequency of an event = frequency of that event total # of all events Eg. Sample 1000 students, get 510 male 510/1000 = 51% male
Relative Frequency Example 2 Vertebrate Number Rel. Freq Amphibians 53 0.06 Turtles 41 0.05 Snakes 204 0.24 Birds 418 0.49 Mammals 136 0.16 53/852 = 0.06 Total 852 1.00 Probability that next animal will be a snake P = 0.24
68.27% 95.44% f 99.73% 3 2 2 3 X 8. The Normal Distribution (Distribusi Normal) : There is an equation which describes the height of the normal curve in relation to its standard dev ()
Normal distribution with σ=1, with varying means μ= 1 μ= 2 μ= 0 ƒ 4 5 -3 -2 -1 0 1 2 3 If you get difficulties to keep this term, read statistics books
σ = 1.5 σ = 2 Normal distribution with μ= 0, with varying standard deviations σ = 1 ƒ -5 -4 -3 -2 -1 0 1 2 3 4 5
Mean, median and mode 9. Symmetry and Kurtosis Symmetry means that the population is equally distributed around the mean i.e. the curve to the right side of the mean is a mirror image of the curve to the left side ƒ
ƒ ƒ Symmetry Data may be positively skewed (skewed to the right) Or negatively skewed (skewed to the left) So direction of skew refers to the direction of longer tail
mode ƒ median mean Symmetry
ƒ ƒ Kurtosis refers to how flat or peaked a curve is (sometimes referred to as peakedness or tailedness) The normal curve is known as mesokurtic A more peaked curve is known as leptokurtic A flatter curve is known as platykurtic
Soal dikerjakan • Banyaknya gol yang dibuat tim Singo Edan pada musim kompetisi tahun lalu adalah 4, 9, 0, 1, 3, 24, 12, 3, 30, 12, 7, 13, 18, 4, 5, dan 15. Dengan menganggap data tersebut sebagai contoh, hitunglah varian, simpangan baku dan koefisien keragamannya. • The mean of snacks weight is 278 g by pack and deviation standard is 9,64 g, and than we have 10 packs. If they are bought from ten different stores, mean of price is Rp. 1200,- and its deviation standard is Rp 90,-, which one have more homogenous, the weight or the price. Explain your answer.
Soal dikerjakan • Some properties of the standard deviation • If a fixed number c is added to all measurements in a data set, will the deviations remain changed? And consequentyl, will s² and s remain changed, too? • If all measurements in a data set are multiplied by a fixed number d, the deviation get multiplied by d. Is it right? What about the s² and s? 4. The teacher’s salary, abbreviated, as follows : 18, 15, 21, 19, 13, 15, 14, 23, 18 and 16 rupiah. If these abbreviation is real salary divide Rp. 100.000,-, find the variance of them.